Login to Ask a Question or Reply
Forum Replies Created by Manoj Mohan
-
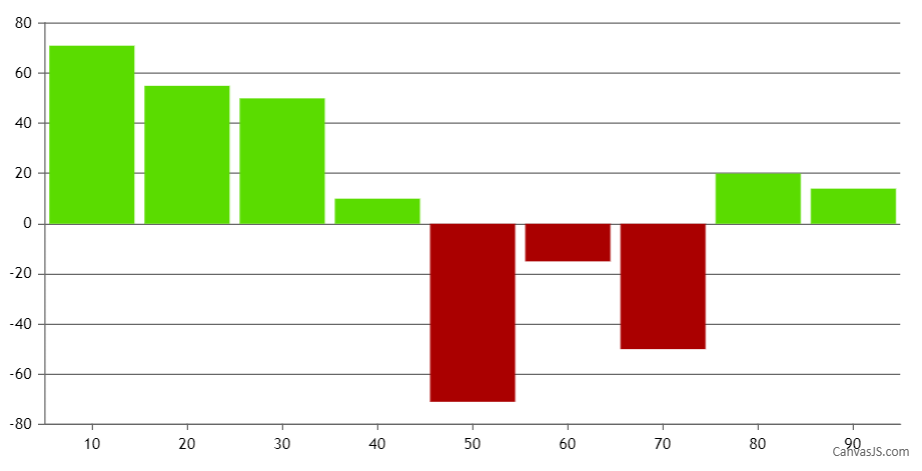
October 7, 2019 at 6:04 pm in reply to: how to change color of column in column chart based on values #27007
You can change the color of column using color property of dataPoint as shown in the code snippet below –
function setColor(chart){
	for(var i = 0; i < chart.options.data.length; i++) {
  	dataSeries = chart.options.data[i];
  	for(var j = 0; j < dataSeries.dataPoints.length; j++){
    	if(dataSeries.dataPoints[j].y <= 0)
      	dataSeries.dataPoints[j].color = 'rgb(170, 0, 0)';
    }
  }
}
Also, please take a look at this JSFiddle which shows setting different colors to positive and negative values.
—-
Manoj Mohan
Team CanvasJSIt’s not possible to position indexLabel with an angle. As of now, it can either be positioned vertical or horizontal. However, we will reconsider this behavior in future versions.
—-
Manoj Mohan
Team CanvasJSSudha,
The issue seems to be with the context of “this” used in the onClick function. Please take a look at this updated sample.
—-
Manoj Mohan
Team CanvasJSSudha,
The issue seems to be with the binding of click-event handler. onClick that’s being assigned to click event in sample.data.ts file is undefined. Please take a look at this updated sample.
—-
Manoj Mohan
Team CanvasJSYes, it will work with frameworks like Angular, React, Vue, etc.
—-
Manoj Mohan
Team CanvasJSYou can trigger the popup/modal to show-up on clicking a datapoint. Please take a look at this JSFiddle for an example on showing Bootstrap modal on clicking on a datapoint.
—-
Manoj Mohan
Team CanvasJSYou can achieve your requirements by attaching click event handler to the dataPoint. Please refer this documentation page for more information along with a live example that you can try out.
If this doesn’t fulfill your requirements, kindly share an example and brief us more about your requirement so that we can understand your scenario better and help you out.
—-
Manoj Mohan
Team CanvasJSTejal,
The value 0 (zero) towards left of the axisY is the label of axisY whereras the value 0 (zero) below the axisX is the label of axisX. As both the values x & y of dataPoint are 0 (zero), the dataSeries line is being drawn from (0,0) co-ordinate. If you like the axisX scale to be started from 0, you can set minimum of axisX to 0.

—-
Manoj Mohan
Team CanvasJSSeptember 25, 2019 at 6:41 pm in reply to: Typescript converts CanvaJS.Chart to undefined when building #26900Please take a look at this sample project to integrate CanvasJS with Angular.
In case you are still facing the issue, kindly share sample project reproducing the issue over google-drive or Onedrive so that we can run sample locally at our end, understand the scenario better and help you out.
—-
Manoj Mohan
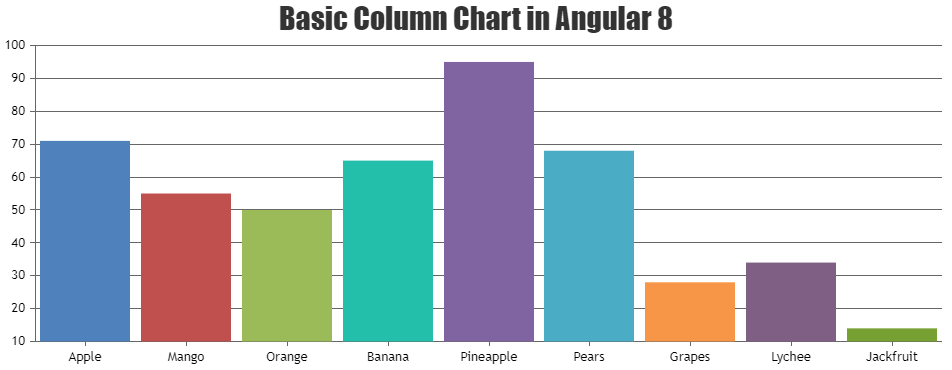
Team CanvasJSSeptember 25, 2019 at 6:31 pm in reply to: Typescript TS7016: Could not find a declaration file for module ‘./canvasjs.min’ #26897CanvasJS Chart supports all versions of angular and chart seems to be working fine in Angular 8. Please take a look at this Sample project for a working example on creating column chart in Angular 8.
If you are still facing the issue, kindly share sample project reproducing the issue over Google-Drive or Onedrive so that we can run sample locally at our end, understand the scenario better and help you out.
—-
Manoj Mohan
Team CanvasJSYou can either use JavaScript Date objects or timestamp to set the startValue and endValue for stripLine if xValueType is set to dateTime. Please take a look at this updated JSFiddle.
—-
Manoj Mohan
Team CanvasJSSorry for the inconvenience caused. We will re-consider to optimize it further in future releases.
—-
Manoj Mohan
Team CanvasJSSorry, placing indexLabel both inside and outside the dataPoint is not possible as of now.
—-
Manoj Mohan
Team CanvasJS