Login to Ask a Question or Reply
Forum Replies Created by Manoj Mohan
-
window.onloadis executed after the entire page (including all dependent resources like images, stylesheets, and scripts) has finished loading. It ensures that all DOM elements and resources (like the CanvasJS script) are available before the code inside window.onload is run.$(document).ready()runs as soon as the DOM is fully loaded and ready, but before other resources (like images and external stylesheets) are completely loaded. Please refer to this link for more information about window.onload.—-
Manoj Mohan
Team CanvasJSIt seems like you’re assigning the same ID to both the chart container and its wrapper. This is likely causing the overlayed canvas (added for the axis) to be removed. Replacing it with a unique ID should resolve this issue. Additionally, you need to call the
copyAxisfunction when the window is resized or when scrolling occurs. Since you’re using Split.js, which doesn’t trigger an event on resizing the div blocks, there might be an issue with the positioning of the axis element. Please take a look at this updated JSFiddle for complete code.—-
Manoj Mohan
Team CanvasJSUpdating all the occurrence of chart object’s variables names in the example should work fine in your case. Please take a look at this updated JSFiddle where chart object is passed as an argument to
copyAxisfunction.—-
Manoj Mohan
Team CanvasJSIt seems like you are using a different variable name for chart object. Replacing it with the proper variable name should work fine in your case.
If you are still facing the issue, kindly create a JSFiddle reproducing the issue you are facing and share it with us so that we can reproduce the issue at our end, understand the scenario better and help you out.
—-
Manoj Mohan
Team CanvasJSThe StackBlitz sample shared above uses CanvasJS StockChart not Chart. Error was being thrown as you were trying to access axisX & axisY as stockchart.charts[0].axisX instead of accessing them directly as stockChart.axisX. Also, we need to consider x-axis bounds instead of y-axis for fixing the axis as you are using Bar chart which has axisX as vertical and axisY as horizontal axis.
Please take a look at this updated JSFiddle for complete working code.
—-
Manoj Mohan
Team CanvasJSWhy do you define dataPoints2 = []; is it used somewhere that is not visible in this example?
Thanks for the feedback. We have updated the sample project.
I tried to drop the necessary code into a existing javascript canvas.js project and I am getting an error.
Can you kindly create a JSFiddle reproducing the issue you are facing & share it with us so that we can look into the code / chart-options being used, understand the scenario better and help you out?
—-
Manoj Mohan
Team CanvasJSTo make the y-axis stationery, you can position an overlayed canvas on top of the stockchart and copy the y-axis onto the overlayed canvas.
Please check this StackBlitz for a working example.
—
Manoj Mohan
Team CanvasJSTo integrate CanvasJS with your PHP application, you can check out this gallery example. To know about the connection changes that need to be done, please take a look at the below lines in the example shown.
// Creating a new connection.
// Replace your-hostname, your-db, your-username, your-password according to your database
$link = new \PDO(   'mysql:host=your-hostname;dbname=your-db;charset=utf8mb4', //'mysql:host=localhost;dbname=canvasjs_db;charset=utf8mb4',
                 'your-username', //'root',
                 'your-password', //'',
                 array(
  \PDO::ATTR_ERRMODE => PDO::ERRMODE_EXCEPTION,
   \PDO::ATTR_PERSISTENT => false
  )
);
Also check out this forum thread for more information about integrating CanvasJS with PHP.
—-
Manoj Mohan
Team CanvasJSCan you please let us know the server side technology being used by you so that we can understand your scenario better and help you with the appropriate steps to integrate in your application?
—-
Manoj Mohan
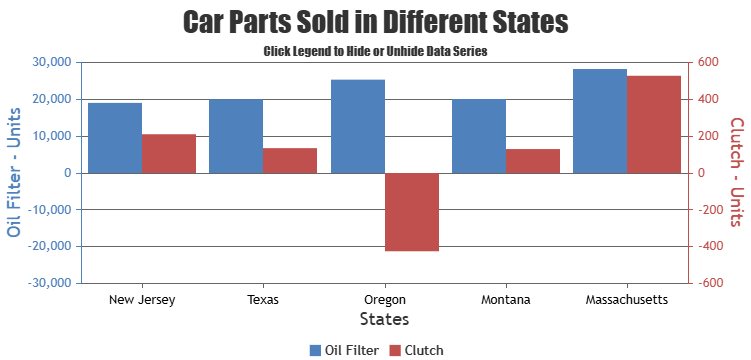
Team CanvasJSAligning the zero value across multiple y-axes is not available as an inbuilt feature as of now. However, you can align it by setting minimum, maximum and interval of the axes dynamically as shown in the code snippet below.
var allAxes = [...chart.axisY, ...chart.axisY2];

allAxes.forEach(axisInstance => {
  var initialMin = axisInstance.get("minimum");
  var initialMax = axisInstance.get("maximum");
  var initialInterval = axisInstance.get("interval");

  var newMin, newMax;

  if (initialMin >= 0) {
    newMin = (-initialMax * desiredFraction) / (1 - desiredFraction);
    newMax = initialMax;
  } else if (initialMax <= 0) {
    newMin = initialMin;
    newMax = (initialMin * (desiredFraction - 1)) / desiredFraction;
  } else {
    newMin = Math.min(
      initialMin,
      (-initialMax * desiredFraction) / (1 - desiredFraction)
    );
    newMax = (-newMin * (1 - desiredFraction)) / desiredFraction;

    // Ensure newMax doesn't undershoot data
    if (newMax < initialMax) {
      newMax = initialMax;
      newMin = (-newMax * desiredFraction) / (1 - desiredFraction);
    }
  }

  // Update axis values & re-render
  axisInstance.set("minimum", newMin, false);
  axisInstance.set("maximum", newMax, false);
  axisInstance.set("interval", initialInterval);
});
Also check out this JSFiddle for the complete working code.
—-
Manoj Mohan
Team CanvasJSWe were unable to reproduce the issue related to disappearing of the chart in the Firefox browser even after running for more than 24hrs.
why, the crosshair, does not work properly here,
Regarding the crosshair behavior, it will always snap to the closest x-axis value when snapToDataPoint is set to true. Since the datapoints on the x-axis are very close to each other, the y-axis crosshair may show values that are not exactly the one you’re expecting. To resolve this, you can try setting snapToDataPoint to false in your use case.
—-
Manoj Mohan
Team CanvasJSWe were unable to reproduce the issue as the code that has been shared above is missing some dependencies when running it. Can you kindly share code along with sample data over Google-Drive or Onedrive so that we can reproduce the issue at our end and help you out?
—-
Manoj Mohan
Team CanvasJSChart seems to be working fine even when opening a page on more than 20 tabs containing 8-10 dynamic/real-time charts. Although we see marginal increase in GPU usage but chart doesn’t disappear. Can you kindly share a complete code over Google-Drive or Onedrive reproducing the issue you are facing along with sample data so that we can look into your code, run it locally at our end to understand the scenario better and help you out?
—-
Manoj Mohan
Team CanvasJSI want to only radius the upper right and left parts of the data series in the column chart. Is this possible?
Sorry, it is not possible to have corner radius in column chart as of now.
Can I set the background color and frame color of the data series in the column chart separately?
Are you looking for interlaced color? To change the color of the column, you can use color property of datapoint. If this doesn’t fulfill your requirement, kindly share a pictorial representation and brief us further about your requirement so that we can understand your scenario better and help you out.
—-
Manoj Mohan
Team CanvasJS