Login to Ask a Question or Reply
Forum Replies Created by Manoj Mohan
-
Can you kindly create a sample project reproducing the issue you are facing and share it with us over Google-Drive or OneDrive so that we can look into the code, run it locally at our end to understand the scenario better and help you out?
—-
Manoj Mohan
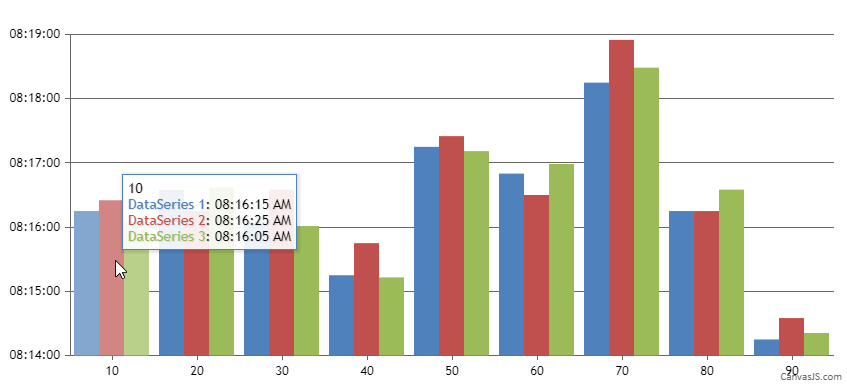
Team CanvasJSDecember 27, 2021 at 7:26 pm in reply to: Time in Axis Y and sync cross hair in multiple series #36585In order to display y values of all the dataSeries in a toolTip, you can loop through each of the e.entries and display the respective y values in appropriate format. Please check out the below code snippet.
contentFormatter: function (e) {
  var content = "";
  content += e.entries[0].dataPoint.x + "<br/>"
  for(var i=0; i<e.entries.length; i++) {
    content += "<span style= \"color:"+e.entries[i].dataSeries.color + "\">" + e.entries[i].dataSeries.name + "</span>: " + CanvasJS.formatDate(e.entries[i].dataPoint.y,"hh:mm:ss TT") + " <br/>";	//Formatting dateTime in ToolTip
  }
  return content;
}
Also, take a look at this JSFiddle for complete code.
—-
Manoj Mohan
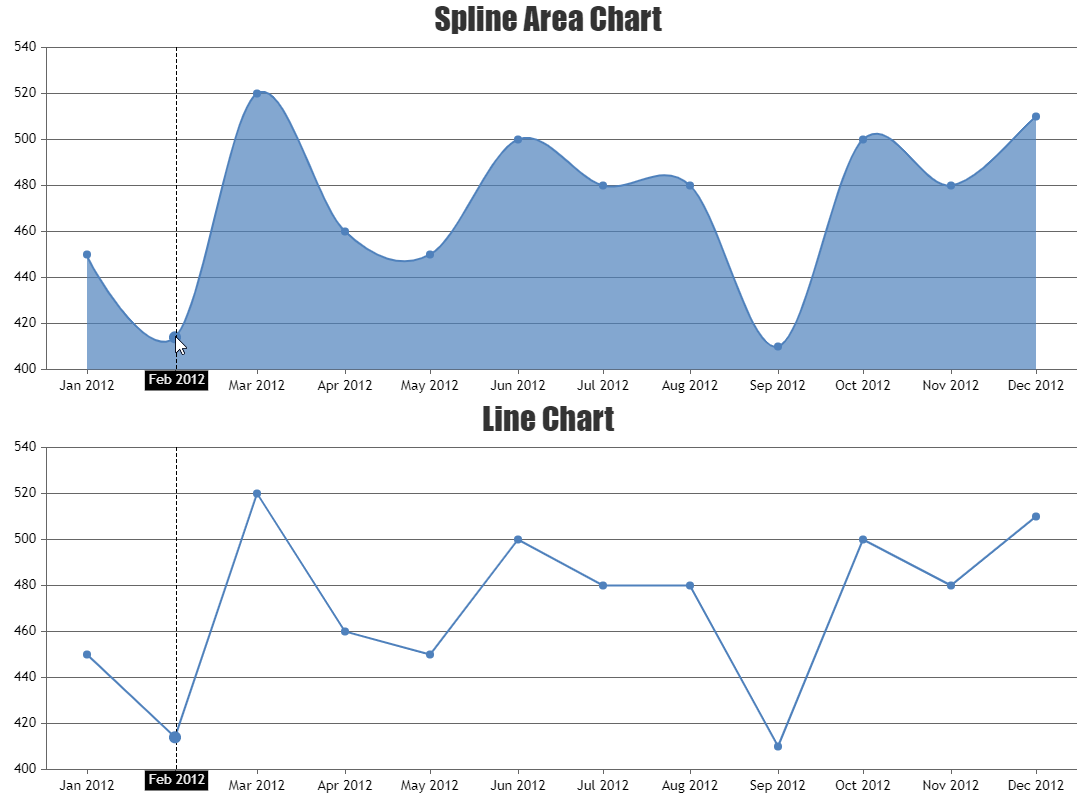
Team CanvasJSYou can highlight the dataPoint without toolTip on hovering over dataPoint by setting the toolTipContent for the dataSeries to null. Please take a look at this StackBlitz example for highlighting dataPoint on hovering over another chart.
—-
Manoj Mohan
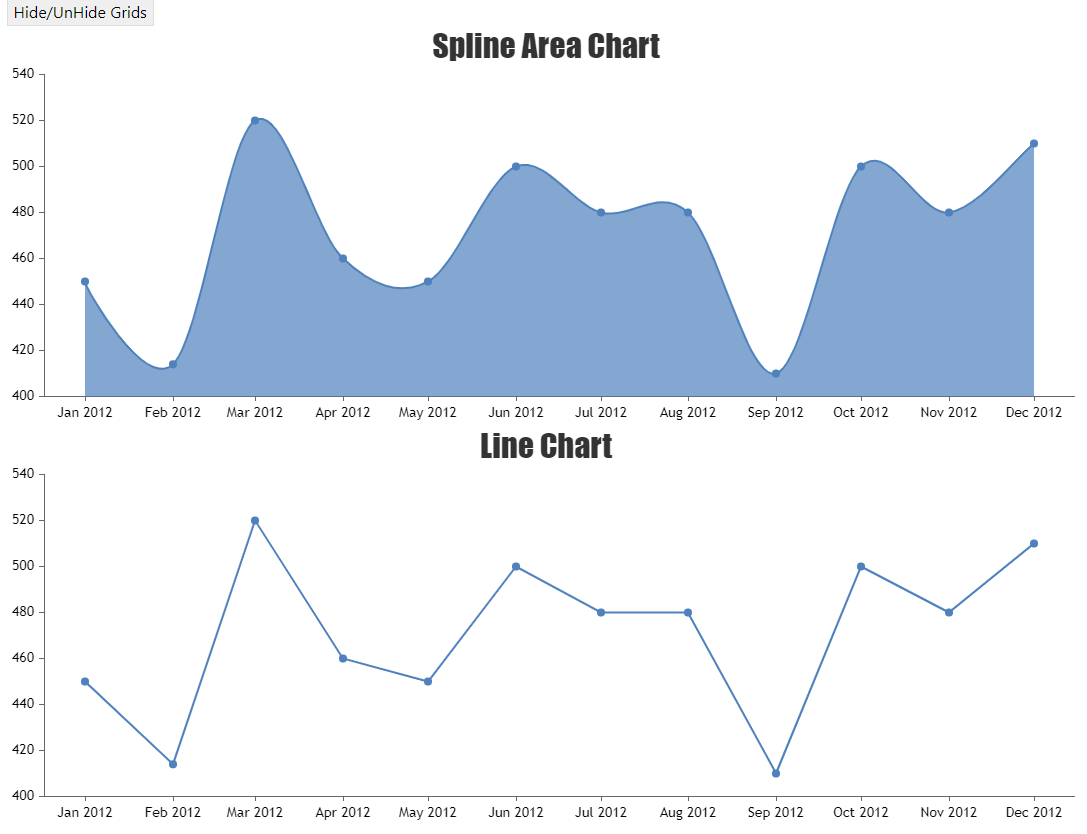
Team CanvasJSYou can hide and unhide the axis gridlines by setting axis gridThickness to 0 and positive value respectively as shown in the below code snippet.
toggleGridLines() {
  for(var i = 0; i < this.charts.length; i++) {
  	for(var j = 0; j < this.charts[i].axisY.length; j++) {
    	this.charts[i].axisY[j].set("gridThickness", (this.charts[i].axisY[j].gridThickness ^ 1))
    }
  }
}
Also, check out this StackBlitz example for hide/unhide axis gridlines on click of a button.
—-
Manoj Mohan
Team CanvasJSThe images shared above seems to be broken. Can you kindly upload the images to imgur and share it with us so that we can understand your scenario better and help you out?
—-
Manoj Mohan
Team CanvasJSDecember 22, 2021 at 11:00 am in reply to: Setting option for every chart in multi-chart view #36553The image shared above seems to be broken. Can you kindly upload the image to imgur and share it with us so that we can understand your scenario better and help you out?
—-
Manoj Mohan
Team CanvasJSNovember 24, 2021 at 8:29 pm in reply to: Canvasjs Chart won’t render using Jsonresult data in Razor Pages #36354Tony,
It seems like the response that you are getting from the AJAX call is of type string instead of JSON. Parsing the response before passing to dataPoints should work fine in your case. Please take a look at this sample project for an example on rendering CanvasJS chart in ASP.NET Core Razor Page Application.
—-
Manoj Mohan
Team CanvasJSNovember 23, 2021 at 6:24 pm in reply to: Canvasjs Chart won’t render using Jsonresult data in Razor Pages #36341Can you kindly create a sample project reproducing the issue you are facing along with sample data and share it with us over Google-Drive and OneDrive so that we can look into the code, run it locally at our end to understand the scenario better and help you out?
—-
Manoj Mohan
Team CanvasJSWe have just released v3.4.6 with the bug fix related to incorrect value parameter in labelFormatter of crosshair when snapToDataPoint for y-axis is set to true. Please check out the release blog for more information. Do download the latest version from our download page and let us know your feedback.
—-
Manoj Mohan
Team CanvasJSThanks for reporting the use-case. There seems to be an issue with value parameter in labelFormatter of crosshair when snapToDataPoint for y-axis is set to true. We will fix it in our future releases.
—-
Manoj Mohan
Team CanvasJSWe have just released v3.4.5 with the bug fix related to showAt method of secondary y-axis crosshair. Please refer to the release blog for more information. Do download the latest version from our download page and let us know your feedback.
—
Manoj Mohan
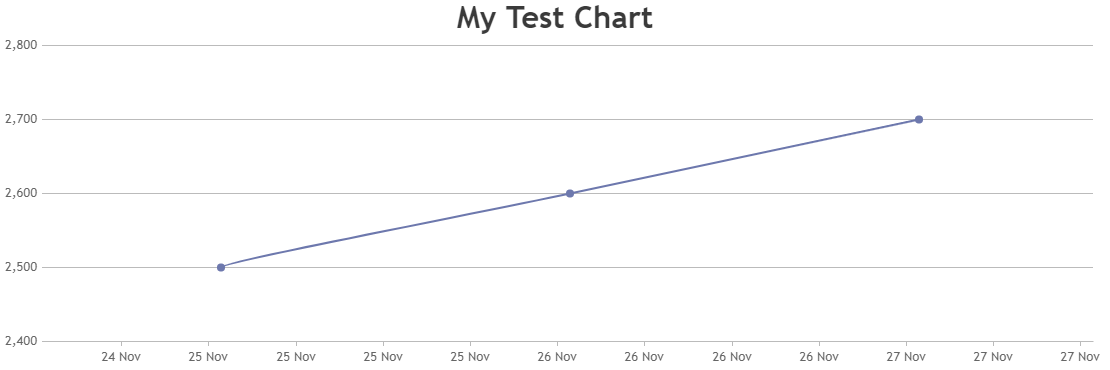
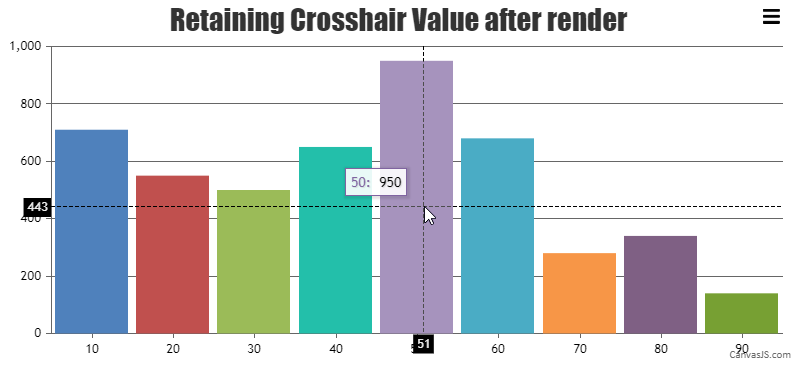
Team CanvasJSWhat I would like to do is automatically display the crosshairs wherever the cursor is after the chart has been rendered without requiring the cursor to move first. Is there any way I can do this?
You can display the crosshairs at the last cursor position after rendering the chart by storing the last cursor position with respective to x and y axis in mousemove event callback function. After the chart render method is called, you can display the crosshair at last cursor position using showAt method. Please take a look at this below code snippet for the same.
setInterval(() => {
    chart.render();

  	//Check if crosshair positions is within plot area
    if( chart.axisX[0].bounds.x1 <= crossHairPositionX && chart.axisX[0].bounds.x2 >= crossHairPositionX && chart.axisY[0].bounds.y1 <= crossHairPositionY && chart.axisY[0].bounds.y2 >= crossHairPositionY) {
      if(crossHairPositionX != null && crossHairPositionY != null) {
        chart.axisX[0].crosshair.showAt(chart.axisX[0].convertPixelToValue(crossHairPositionX));
        chart.axisY[0].crosshair.showAt(chart.axisY[0].convertPixelToValue(crossHairPositionY));
      }
    }

  }, 1000);

  $(".canvasjs-chart-canvas").last().on("mousemove", function(e) {
    var parentOffset = $(this).parent().offset();
    var relX = e.pageX - parentOffset.left;
    crossHairPositionX = relX;
    var relY = e.pageY - parentOffset.top;
    crossHairPositionY = relY;
  });
Also check out this updated JSFiddle for complete working code.
The last note is that for whatever reason, the showAt method does not seem to work for the Y2 axis at all. I don’t understand why but if you look at this jsfiddle, which is the same in every way from the one above except I’m using the Y2 axis, you’ll see that the crosshair will not display for the Y2 axis using the showAt method
Thanks for reporting the use-case. It seems like a bug & we will fix it in our upcoming versions.
—-
Manoj Mohan
Team CanvasJSCan you kindly create JSFiddle reproducing the issue you are facing and share it with us so that we can look into the code / chart-options being used, understand the scenario better, and help you out?
—-
Manoj Mohan
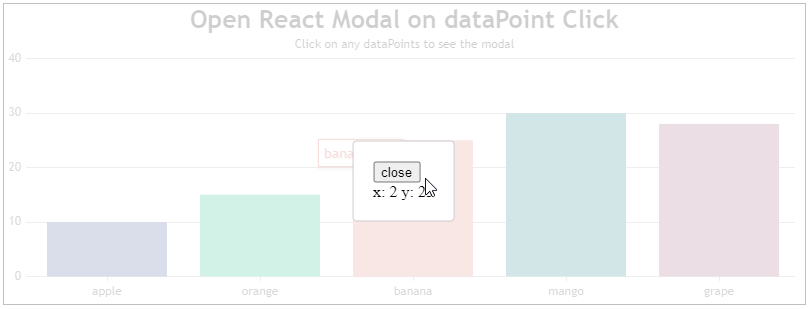
Team CanvasJSOctober 6, 2021 at 7:17 pm in reply to: Open Bootstrap Remote Modal from e.dataPoint.link onClick Event #35954You can use react-modal module to generate modal and bind the click event in dataPoint to open modal as shown in the below code snippet.
 openModal(e) {
    this.setState({showModal: true, x: e.dataPoint.x, y: e.dataPoint.y});
  }
  .
  .
  .
   const options = {
      data: [
        {
          //Change type to "line", "bar", "area", "pie", etc.
          type: "column",
          click: this.openModal,
          dataPoints: [
            { label: "apple",  y: 10  },
            { label: "orange", y: 15  },
            { label: "banana", y: 25  },
            { label: "mango",  y: 30  },
            { label: "grape",  y: 28  }
          ]
        }
      ]
    },
    .
    .
    .
    <Modal
      isOpen={this.state.showModal}
      contentLabel="Modal"
      style={customStyles}
     >
     .
     .
Please checkout this StackBlitz project for an example on the same.
——
Manoj Mohan
Team CanvasJSOctober 5, 2021 at 7:34 pm in reply to: How to open a modal on onClick event of a data point in react js #35932Can you kindly create a sample project reproducing the issue you are facing and share it with us over Google-Drive or OneDrive so that we can look into the code, run it locally at our end to understand the scenario better and help you out?
—
Manoj Mohan
Team CanvasJS