Login to Ask a Question or Reply
You must be logged in to post your query.
Home › Forums › Chart Support › Chart within ToolTip or Chart within a Chart
Chart within ToolTip or Chart within a Chart
- This topic has 3 replies, 2 voices, and was last updated 4 years, 10 months ago by
Manoj Mohan.
Tagged: Chart within Chart, toolTipContent
-
September 8, 2021 at 8:10 pm #35655
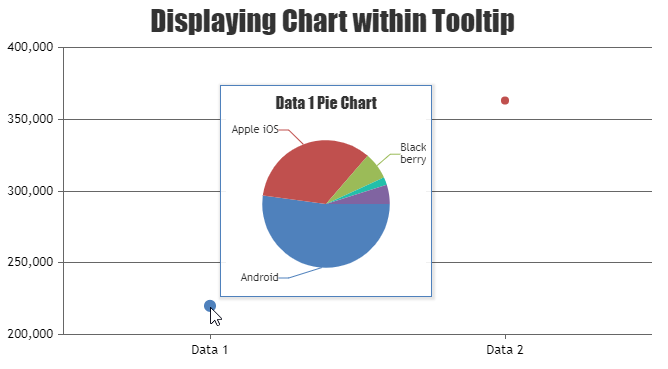
Hello, I was wondering if anyone can tell me if it is possible to put a chart within the toolTipContent of another chart. Basically, I have a scatter chart and when someone mouseovers a datapoint, I would like a pie chart to show for that datapoint.
Currently, I have tried to put a <div id=”piechart”></div> in the toolTip, then create the pie chart script pointing to that id, but it doesn’t work that way. If there is another way to do this besides using toolTipContent, I am all ears.
September 9, 2021 at 8:41 pm #35670To display a chart inside tooltip, you can create a DOM required for the chart within tooltip using contentFormatter and render the chart on updated event of toolTip. Please take a look at this below code snippet for the same.
toolTip: {
      updated: function(e) {
        typeof pieChart.destroy === "function" && pieChart.destroy();
        pieChart = new CanvasJS.Chart('pie-chart', chartOptions[e.entries[0].dataPoint.label]);
        pieChart.render();
      },
      contentFormatter: function() {
        return "<div id='pie-chart' style='width:200px; height:200px;'></div>";
      },
}
Also, check out this JSFiddle for complete sample code for rendering the chart within tooltip.
—-
Manoj Mohan
Team CanvasJSSeptember 13, 2021 at 8:50 pm #35706Hello Manoj,
Thank you for that solution! At least I know it is possible to do this. However, the issue I am still having is that the pie chart has to be built based on datapoints sent to each scatter chart point.
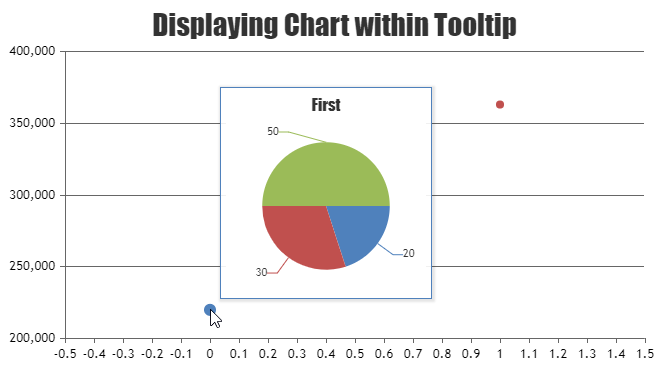
For example, my incoming datepoints for the scatter chart are from a PHP array:
var data = <php echo json_encode($dpoints, JSON_NUMERIC_CHECK); ?>;In that PHP array are values such as [[0] x: 5, y: 10, name: First, pie1: 20, pie2: 30, pie3: 50],[1]…
While the scatter chart pulls the x, y, and name values, I need the pie chart to pull the pie1, pie2, pie3 values and render for each data set in the array.
September 14, 2021 at 7:33 pm #35726You can pass the pie1, pie2,… values to respective dataPoints of the scatter chart and on displaying the tooltip, you can get the values for pie chart using
e.entries[0].dataPointsobject. Please take a look at the code snippet below for the same.. . toolTip: { updated: function(e) { typeof pieChart.destroy === "function" && pieChart.destroy(); pieChart = new CanvasJS.Chart('pie-chart', chartOptions); pieChart.options.title.text = e.entries[0].dataPoint.name; pieChart.options.data[0].dataPoints = []; pieChart.options.data[0].dataPoints.push({y: e.entries[0].dataPoint.pie1}); pieChart.options.data[0].dataPoints.push({y: e.entries[0].dataPoint.pie2}); pieChart.options.data[0].dataPoints.push({y: e.entries[0].dataPoint.pie3}); pieChart.render(); }, contentFormatter: function() { return "<div id='pie-chart' style='width:200px; height:200px;'></div>"; }, hidden: function() { typeof pieChart.destroy === "function" && pieChart.destroy(); } } . . dataPoints: [ { y: 219960, name: "First", pie1: 20, pie2: 30, pie3: 50}, { y: 363040, name: "Second", pie1: 60, pie2: 20, pie3: 40} ] . .Please take a look at this JSFiddle for complete working code.
—-
Manoj Mohan
Team CanvasJS
Tagged: Chart within Chart, toolTipContent
You must be logged in to reply to this topic.