Login to Ask a Question or Reply
Forum Replies Created by Indranil
-
January 9, 2018 at 10:07 am in reply to: Dynamic Chart php did not send data to $.getJSON() using PHP,MYSQL,CanvasJS #18614
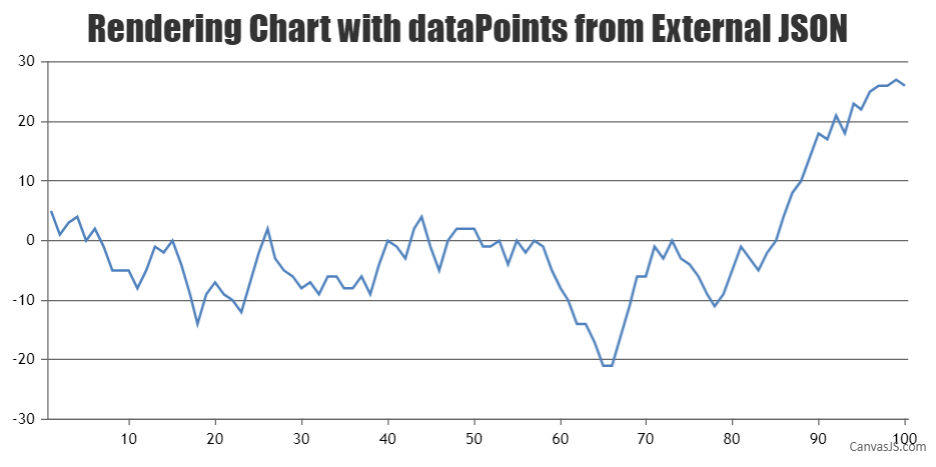
Please take a look at Rendering Charts from JSON API using AJAX for step to step instruction on rendering chart from JSON data. Also, kindly check this gallery example for chart from JSON data in PHP. Could you please provide the sample JSON data returned from myphpService.php so that we can look into the data and help you out?

___________
Indranil Deo
Team CanvasJSJanuary 8, 2018 at 9:37 am in reply to: Dynamic Chart php did not send data to $.getJSON() using PHP,MYSQL,CanvasJS #18605Can you please check your Browser Console for any errors? Also, can you please create a sample project and share your code, so that we can look into it and help you out.
___________
Indranil Deo,
Team CanvasJSJames,
getDate(), getDay(), getMonth() are Javascript Date Methods. For more info on Javascript Date Methods please take a look at this tutorial.
___________
Indranil Deo,
Team CanvasJSJames,
Please take a look at this updated jsfiddle.
___________
Indranil Deo,
Team CanvasJS-
This reply was modified 8 years, 1 month ago by
Indranil.
Can you please open up the Browser Console and check if there is any error. Also, can you please create a jsfiddle reproducing the issue so that we can look into the code and help you out better.
___________
Indranil Deo,
Team CanvasJSDecember 22, 2017 at 10:23 am in reply to: double stackedColumn on negative and positive Y axis #18364Please take a look at this updated jsfiddle.
___________
Indranil Deo,
Team CamvasJS-
This reply was modified 8 years, 1 month ago by
Indranil.
Thanks for the suggestion. We will consider this behavior in future versions.
___________
Indranil Deo,
Team CanvasJSAs of now, title font-size is accepted in pixels only. However, the title font-size is calculated based on the width of the chart.
__________
Indranil Deo,
Team CanvasJSYou can use labels to display text on X Axis. Please take a look at axisX labels.
___________
Indranil Deo,
Team CanvasJSPlease download this sample which uses ASP.NET and ORACLE for rendering CanvasJS Chart.
A readme file has been included for your convenience with all the instructions to set up the project and get the charts running.___________
Indranil Deo,
Team CanvasJS-
This reply was modified 8 years, 1 month ago by
Indranil.
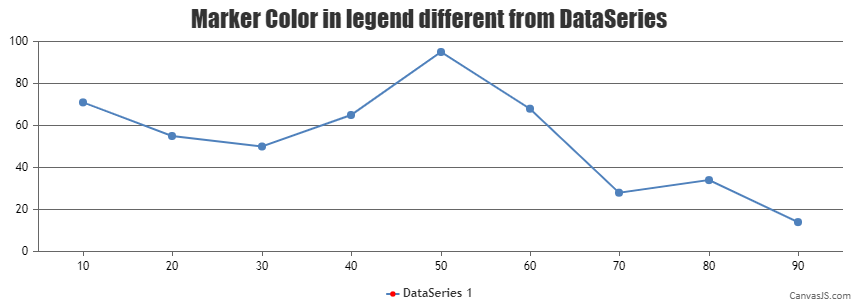
December 18, 2017 at 10:47 am in reply to: legend Line Color does not inherit color of data series #18309Glad you figured it out. Also, you can set the legend marker color using the legendMarkerColor property. Please take a look at this documentation page for more information.

__________
Indranil Deo,
Team CanvasJS -
This reply was modified 8 years, 1 month ago by