Login to Ask a Question or Reply
Forum Replies Created by Anjali
-
Robert,
We have fixed the issue and we’ll be releasing it tomorrow.
Thanks for reporting.
__
AnjaliThere are few issues in your code. So please correct the below mentioned points:
1) You are using jQuery file in the end because of which $ is not define when you are trying to do $(document).ready. Please use jQuery before $(document).ready.
2) While rendering the chart you are using data object twice
data: [
{
indexLabelPlacement: “outside”,
indexLabelFontWeight: “bold”,
indexLabelFontColor: “black”,
data: [
{
type: “column”
dataPoints: dataPoints
}
]Below is the code with the issues fixed.
<!DOCTYPE HTML>
<html>
<head>
<meta http-equiv="Content-Type" content="text/html; charset=utf-8">
<script type="text/javascript" src="jquery-2.1.1.js"></script>
<script type="text/javascript">
$(document).ready(function () {

	$.ajax({
		type: "GET",
		url:"data2.csv",
		dataType: "text",
		success: function(data) {processData(data);}
	});

	function processData( allText ) {
		var allLinesArray = allText.split("\n");
		if( allLinesArray.length > 0 ){
			var dataPoints = [];
			for (var i = 0; i <= allLinesArray.length-1; i++) {
				var rowData = allLinesArray[i].split(",");
				dataPoints.push({ label:rowData[0], y:parseInt(rowData[1]) });
			}
			drawChart(dataPoints);
		}
	}

	function drawChart( dataPoints) {
		var chart = new CanvasJS.Chart("chartContainer", {
			title:{
				text: "ID"
			},
			axisX:{
				labelAngle: 0,
				labelWrap:true,
				labelAutoFit: false,
				labelFontSize: 15,
				labelMaxWidth: 200,
				labelFontColor: "black"
			},
			data: [
			{
				indexLabelPlacement: "outside",
				indexLabelFontWeight: "bold",
				indexLabelFontColor: "black",
				type: "column",
				dataPoints: dataPoints
			}
			]
		});
		chart.render();
	}
});
</script>
<script type="text/javascript" src="canvasjs.min.js"></script>
</head>
<body style="background-color: #ADB68B; background-image:url(../Images/bg_body_new.png); background-repeat: repeat-x;text-align:center">
<div id="chartContainer" style="height: 800px; width: 100%; background-image:url("fonto1.png"); background-repeat:no-repeat; background-position:center; background-size:100% 100%"></div>
<div style="text-align: center; color:red; font-size:25px;"><b>Τελευταία Ενημέρωση 27 Μαρ 2015 12:00</b></div>
</body>
</html>
__
Anjalinirmala,
Yes, CanvasJS supports dateTime values, please refer this article. We have replied with an example in the other thread which you have created.
__
Anjalibrouzdalek,
As of now it is not possible to integrate MathJax output with CanvasJS Charts.
__
AnjaliRobert,
Thanks for the reporting, we will look into the issue and get back at the earliest.
__
Anjalipepelopez,
Y Axis does not support dateTime values as of now. It is available only on x axis.
__
Anjalibrouzdalek,
With the existing API of CanvasJS itself you can show exponent values in axis labels. Please use valueFormatString property for formatting the numbers and suffix/prefix for any additional characters. Here is an example.
__
Anjalirepazol,
This feature is not available yet.
__
AnjaliAs of now it is not possible to find out automatically set colors of dataSeries. But you can set color to dataSeries yourself so that you can use the same for checkbox.
__
Anjali06chaynes,
Can you please explain what you mean by “automatically export”? In case you meant saving to the disk, then it is not possible because of browser restrictions.
__
Anjalidodo,
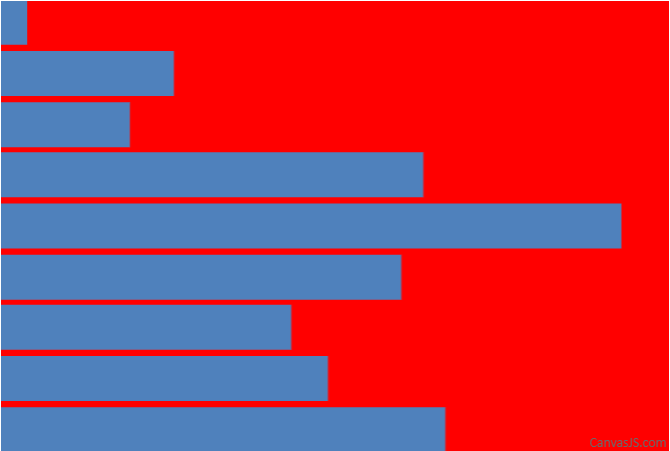
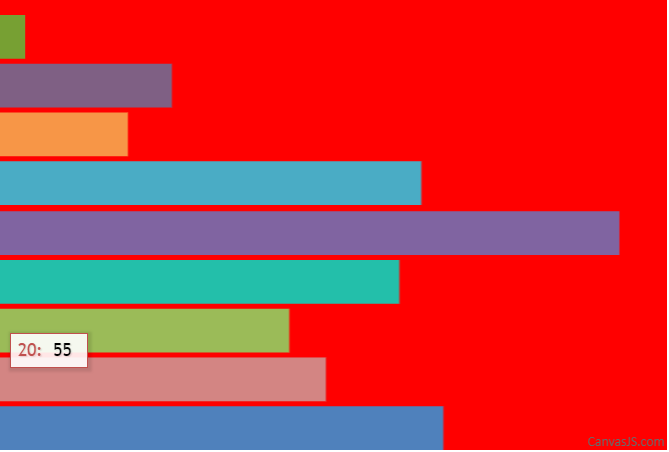
As you are looking to remove margin from all four sides, you can add a dummy dataSeries with no dataPoints and secondary axisX and axisY. Code snippet shared below shows the same:
var chart = new CanvasJS.Chart("chartContainer",{
  backgroundColor: "red",
  axisX: {
    valueFormatString: " ",
    lineThickness: 0,
    gridThickness: 0,
    tickLength: 0,
    margin: -10,
  },
  axisY: {
    valueFormatString: " ",
    lineThickness: 0,
    gridThickness: 0,
    tickLength: 0,
    margin: -10
  },
  axisX2: {
    valueFormatString: " ",
    lineThickness: 0,
    gridThickness: 0,
    tickLength: 0,
    margin: -10,
  },
  axisY2: {
    valueFormatString: " ",
    lineThickness: 0,
    gridThickness: 0,
    tickLength: 0,
    margin: -10
  },
  data: [
    {
      type: "bar",
      dataPoints: [
        { x: 10, y: 71 },
        { x: 20, y: 55},
        { x: 30, y: 50 },
        { x: 40, y: 65 },
        { x: 50, y: 95 },
        { x: 60, y: 68 },
        { x: 70, y: 28 },
        { x: 80, y: 34 },
        { x: 90, y: 14}
      ]
    },
    {
      type: "bar",
      axisXType: "secondary",
      axisYType: "secondary",
      dataPoints: []
    }
  ]
});

chart.render();
Please take a look at this JSFiddle for a working example with sample code.

__
Anjali
Team CanvasJSmegarog4,
Sorry, it is not possible yet.
__
Anjalielvinas,
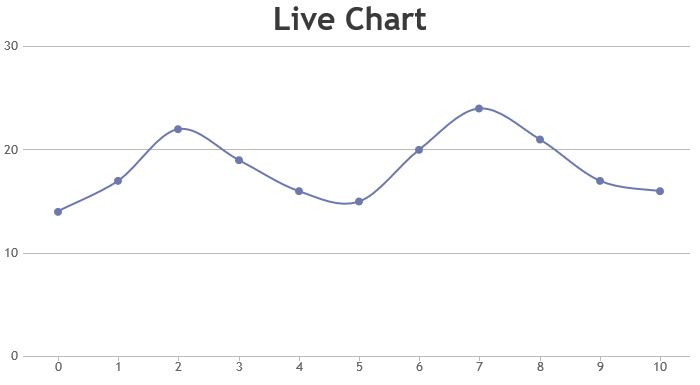
For every update you shouldn’t recreate the chart. Instead you should create chart only once and later updated only its values as shown below:
var chart = new CanvasJS.Chart("chartContainer", {
	data: [
		{
			dataPoints: null
		}
	]
});
and don’t render the chart here. Inside getJSON access the chart’s options and assign the result’s data to dataPoints and render the chart. Below is the code snippet:
$.getJSON("data.php", function (result) {

	chart.options.data[0].dataPoints = result;
	chart.render();
});
and update the dataPoint’s data at a given interval.
var updateChart = function() {

	$.getJSON("chart.php", function (result) {

		chart.options.data[0].dataPoints = result;
		chart.render();

	});
}
setInterval(function(){updateChart()},1000);
Also, you can checkout this example which updates chart data every 1500 milliseconds.

__
Anjali
Team CanvasJSdodo,
As of now the margins for the plot area are automatically calculated and can’t be customized. For removing the extra margin from the bottom and left you can set axisX margin and axisY margin to -10 as shown below:
axisX: {
  margin: -10
},
axisY: {
  margin: -10
}
Please take a look at this JSFiddle for a working example with sample code.

__
Anjali
Team CanvasJS