Home Forums Chart Support Remove all paddings and margins

Remove all paddings and margins

Viewing 6 posts - 1 through 6 (of 6 total)
  • #8277

    I would like to remove all paddings and margins in charts in order to align the chart with an adjacent grid. You can find the working fiddle below, I removed all the margins that I can find but the chart still has paddings from bottom, top and left.

    http://jsfiddle.net/teoj05js/1/

    #8290

    dodo,

    As of now the margins for the plot area are automatically calculated and can’t be customized. For removing the extra margin from the bottom and left you can set axisX margin and axisY margin to -10 as shown below:

    axisX: {
      margin: -10
    },
    axisY: {
      margin: -10
    }

    Please take a look at this JSFiddle for a working example with sample code.

    CanvasJS Basic Bar Chart with negative axisX margin

    __
    Anjali
    Team CanvasJS

    #8296

    Hi Anjali,

    I can remove the bottom and the left margins with negative values, but can’t remove the top margin. Is there any way to do that, if not do you have any plans to implement such a feature.

    #8307

    dodo,

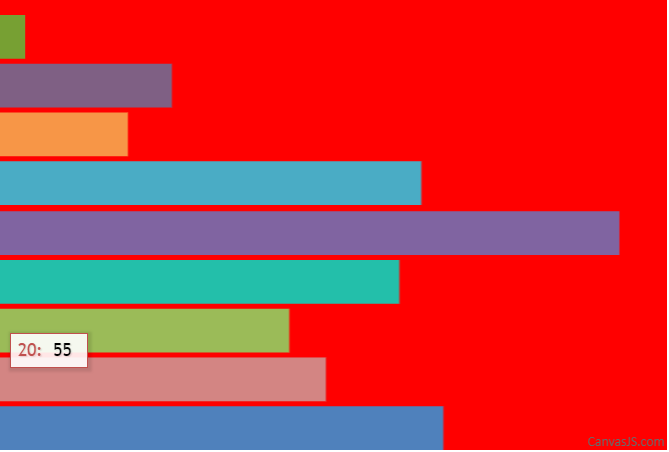
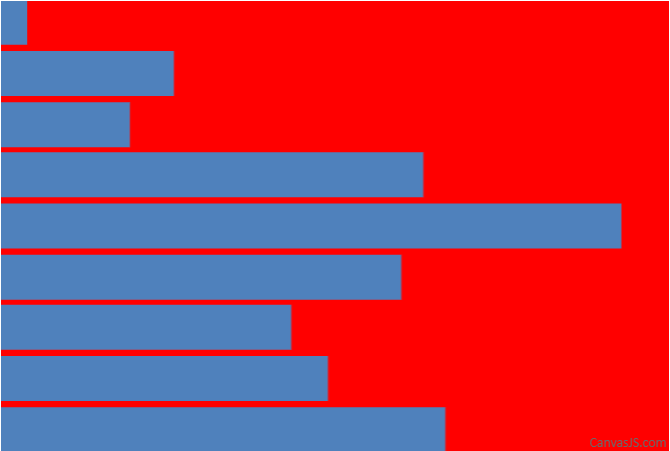
    As you are looking to remove margin from all four sides, you can add a dummy dataSeries with no dataPoints and secondary axisX and axisY. Code snippet shared below shows the same:

    var chart = new CanvasJS.Chart("chartContainer",{
      backgroundColor: "red",
      axisX: {
        valueFormatString: " ",
        lineThickness: 0,
        gridThickness: 0,
        tickLength: 0,
        margin: -10,
      },
      axisY: {
        valueFormatString: " ",
        lineThickness: 0,
        gridThickness: 0,
        tickLength: 0,
        margin: -10
      },
      axisX2: {
        valueFormatString: " ",
        lineThickness: 0,
        gridThickness: 0,
        tickLength: 0,
        margin: -10,
      },
      axisY2: {
        valueFormatString: " ",
        lineThickness: 0,
        gridThickness: 0,
        tickLength: 0,
        margin: -10
      },
      data: [
        {
          type: "bar",
          dataPoints: [
            { x: 10, y: 71 },
            { x: 20, y: 55},
            { x: 30, y: 50 },
            { x: 40, y: 65 },
            { x: 50, y: 95 },
            { x: 60, y: 68 },
            { x: 70, y: 28 },
            { x: 80, y: 34 },
            { x: 90, y: 14}
          ]
        },
        {
          type: "bar",
          axisXType: "secondary",
          axisYType: "secondary",
          dataPoints: []
        }
      ]
    });
    
    chart.render();

    Please take a look at this JSFiddle for a working example with sample code.

    CanvasJS basic bar chart with negative margin for axes

    __
    Anjali
    Team CanvasJS

    #34125

    That doesn’t seem to get rid of all the padding on the right hand side.

    #34137

    @ebrewer,

    Removing padding towards secondary x-axis in the given example is not possible as of now. However setting negative margin to all the axes is the nearest solution that you can achieve in the above example.

    If you could share JSFiddle with your use-case, we can suggest you possible solution according to the use-case.


    Vishwas R
    Team CanvasJS

Viewing 6 posts - 1 through 6 (of 6 total)

You must be logged in to reply to this topic.