React Combination Charts & Graphs
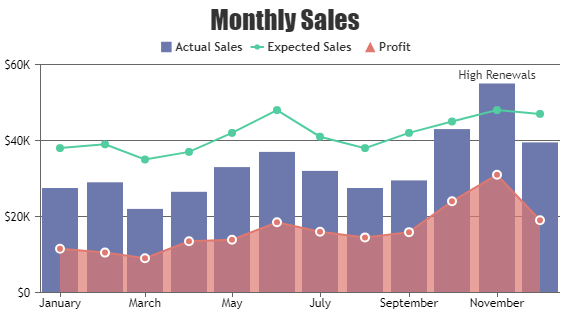
React Combination Charts, also known as Combo or Mixed Charts, allow you to combine different chart types like line, column, area, range, ohlc, candlestick, and more into a single chart. For example, to display both the total sales and sales trend over time in single chart.
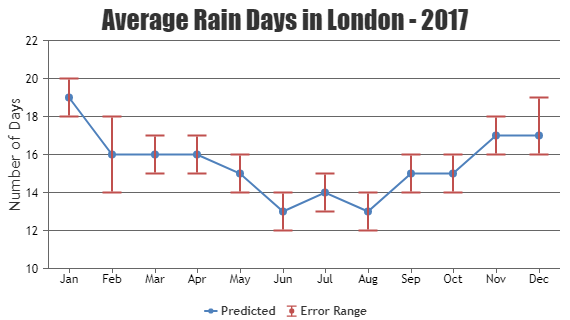
Combination of candlestick chart with line or column chart as technical indicators is commonly used for visualizing financial chart. Also, Range and Line Charts are commonly used together to display data ranges (high and low values) alongside average values. For instance, in quality control for monitoring of products, upper and lower limit of tolerance measurement can be drawn with Range Area Chart while line chart depicting the ideal measurement value.
React Combination Charts
Combination Charts (Combo / Mixed Charts) are formed by combining multiple chart types in one chart.
Features used Commonly in React Combination Charts
- Shared ToolTip: Instead of having separate tooltip for each data series, combine all the relevant information across data series into one tooltip by setting shared property of tooltip to true.
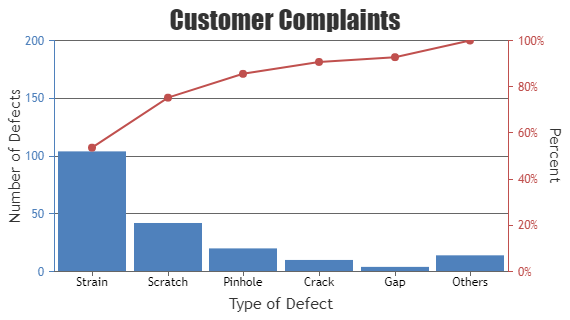
- Multiple Y-Axis: Combination charts with multiple axes allow you to display multiple data series that have different units or range of values on the same chart. This is useful when comparing data sets that are related but measured differently, as it ensures each series is clearly visible and comprehensible.
- Hide/UnHide DataSeries: Hiding and Unhiding dataseries on clicking legend allow to focus on specific data series or compare different subsets of data without cluttering the chart.
General Tips for React Combination Charts
- Indicators in Financial Chart: Line Chart can be used for most of the technical indicators in Financial/Stock Chart.
- Rendering Order: When combining an area chart with any other chart type, prioritize rendering the area chart first, followed by the other chart types. Otherwise, area chart could hide other chart type.
- Use Opacity: In combination charts, consider using opacity to make sure that overlapping series don’t hide each other.


