Vue.js Area Charts
Vuejs Area Chart can be considered as an extension of line chart with the area between line & axis baseline filled. Area charts are better suited if total area covered is also of importance along with individual values. Library supports multiple variants of area charts like area, spline area, step area, stacked area & stacked area 100% chart.
Vue.js Area Charts
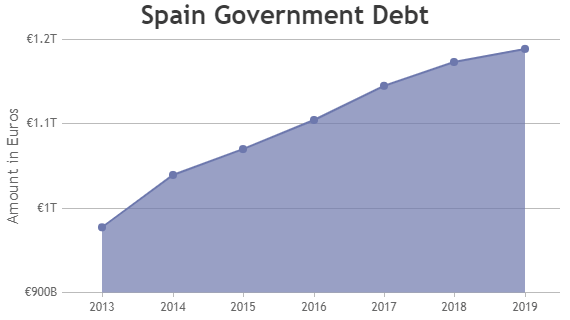
Area Charts are basically line charts with area between the line & axis baseline filled.
Vue.js Spline Area Charts
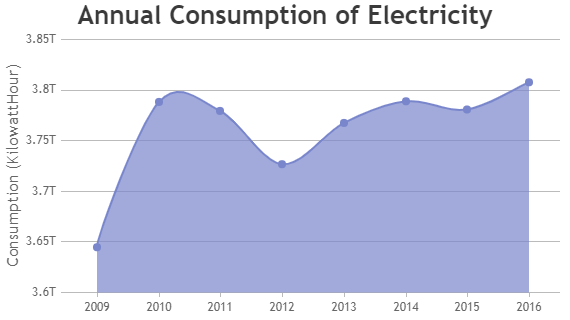
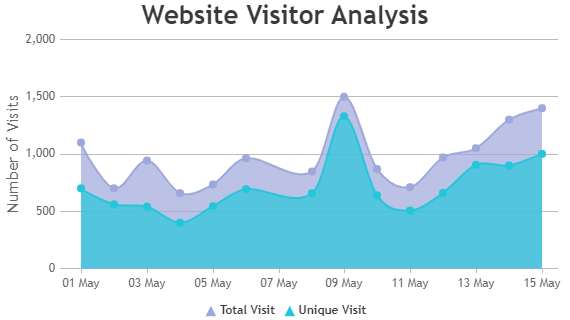
Spline Area Chart is similar to area chart except that the envelope of area is covered with a smooth line.
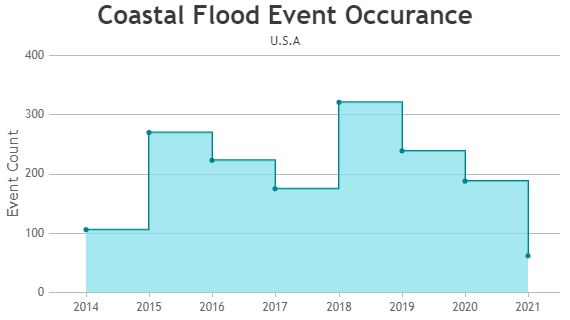
Vue.js Step Area Charts
Step Area charts are like Step Line Chart except that the enclosed area is shaded.
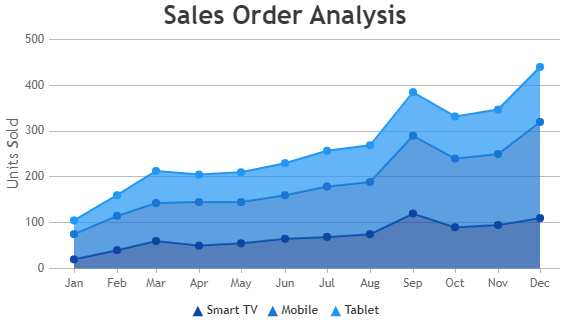
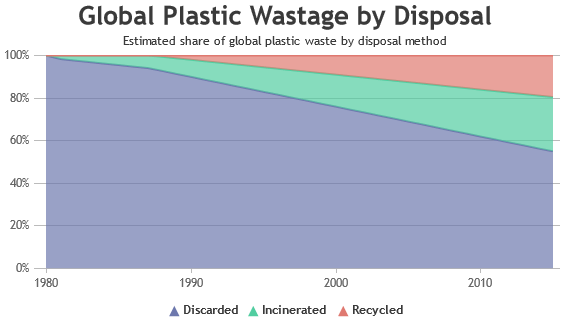
Vue.js Stacked Area Charts
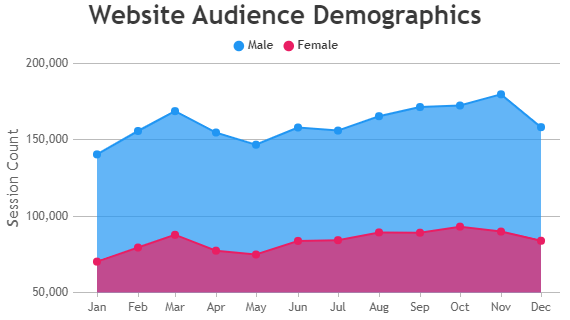
Stacked Area Chart are used to show part-to-whole relationships between multiple dataseries. Stacked Area 100% is same as Stacked Area except that areas are rendered as a percentage of total value at any given point.
Features used Commonly in Vue.js Area Charts
Most commonly used features in Vuejs Area Charts include markers, opacity, colors, index / data-labels, etc.
- Size & type of the marker can be customized by setting markerSize & markerTypeproperties.
- Color of the filled region in area chart can be changed by setting color property.
- Opacity of the filled region can be controlled by setting fillOpacity property.
- Indexlabel can be shown next to particular bar by setting indexLabel property of datapoint
Vue.js Area Chart Types
General Tips for Vue.js Area Charts
- In case of area charts, ensure that the data isn’t obscured in the background. Order dataseries thoughtfully and use transparency if required.
- Use index / data-labels to show additional information about the datapoint. But be very selective with it’s content as adding too many labels might affect it’s readability.
- Don’t use a stacked area chart when you want to show individual values accurately. Area charts are better suited in such cases.
