Vue.js Pie & Doughnut Charts
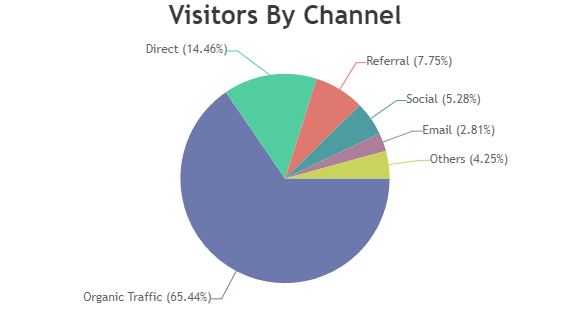
Vuejs Pie Charts are created by dividing a circle into multiple slices that are proportional to their contribution towards the total sum. Sometimes they are also referred to as Circular Charts.
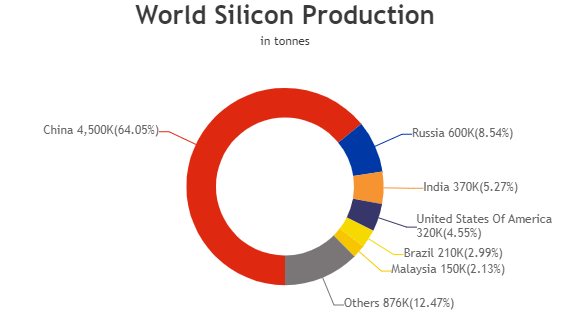
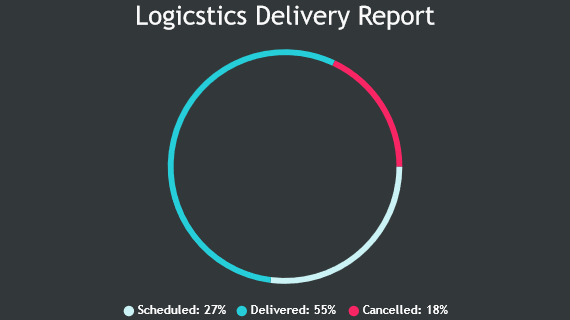
Vuejs Doughnut / Donut Charts are similar to pie charts but with a hollow center. Just like pie chart, doughnut charts are used to compare contribution of individual datapoints to the total. Clicking on each slice either explodes or implodes based on it's current state.
Vue.js Pie Charts
Pie Chart is a circular chart divided into slices proportionally based on contribution of individual datapoints to their total.
Vue.js Doughnut / Donut Charts
Doughnut Charts are same as Pie Charts with a hollow center.
Features used Commonly in Vue.js Pie & Doughnut Charts
Most commonly used features in Vuejs Pie & Doughnut Charts include customizing radius, inner-radius, start angle, exploding slice by default, changing legend text, etc.
- Size of the pie / doughnut can be changed by setting radius property.
- In case of doughnut chart, the inner radius can be changed to make hollow space less / more by setting innerRadius property.
- You can rotate the pie / doughnut chart by setting startAngle property.
- You can explode one or more slice(s) of pie / doughnut chart during initial chart render by setting exploded property.
- The datapoint name shown in the legend can be changed by setting legendText / name property.
Vue.js Pie & Doughnut Chart Types
General Tips for Vue.js Pie & Doughnut Charts
- Use annotations (index / data labels) to improve readability.
- Limit the number of slices by merging smaller datapoints/categories. Pie / Doughnut charts with a large number of slices can be difficult to read.
- Use unique colors for each category and make sure they have enough contrast for good legibility.


