Vue.js Column Charts
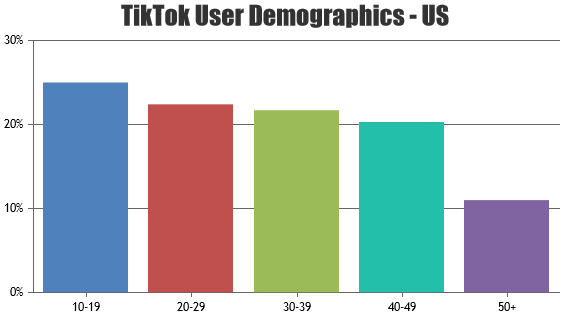
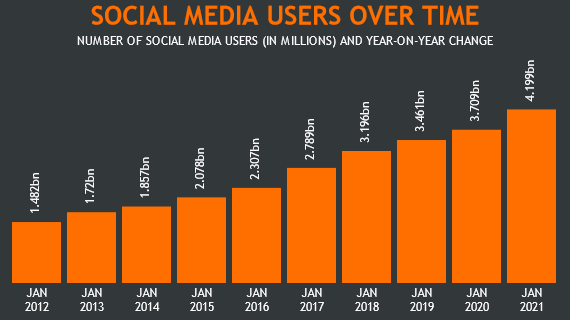
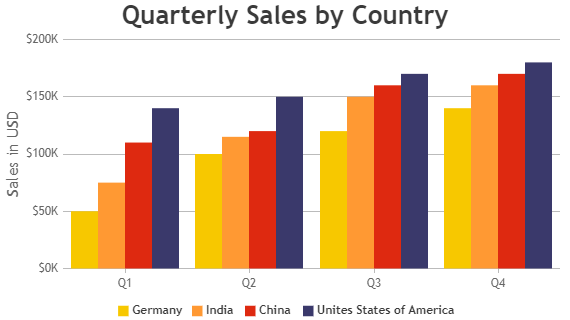
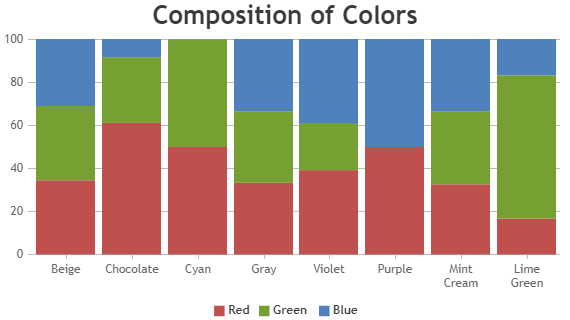
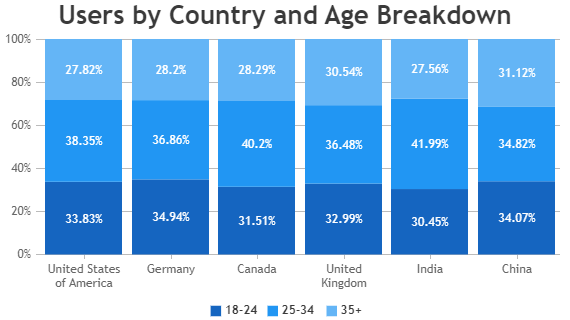
Vuejs Column Chart uses vertical bars with their length proportionate to the datapoint y-value. Column charts are also referred to as Vertical Bar Charts. In column charts, categories are typically organized along the horizontal axis called axisX and values along the vertical axis called axisY. Library supports different variants of Column Charts like, Multi-Series Column, Stacked Column & Stacked Column 100% Charts.
Vue.js Column Charts
Column Charts use vertical bars to compare value between different categories/series.
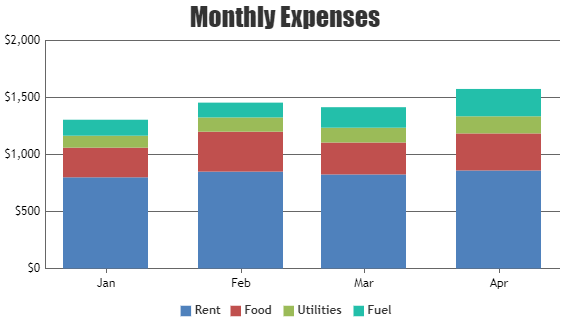
Vue.js Stacked Column Charts
Stacked Column Chart is formed by stacking multiple data-series one on top of another.
Features used Commonly in Vue.js Column Chart
Most commonly used features in Vuejs Column Chart includes beveling the column, opacity of the bars, datapoint max-width, index-labels, etc.
- Beveling / Chisel effect on each column can be enabled by setting bevelEnabled property to true.
- Opacity of each series can be changed by setting fillOpacity property.
- Datapoint max-width can be controlled by setting dataPointMaxWidth property.
- Indexlabel can be shown on top of particular column by setting indexLabel property of datapoint.
Vue.js Column Chart Types
General Tips for Vue.js Column Charts
- Use multiple axes when two dataseries have different units or range of data.
- It is recommended to sort datapoints in ascending order of x values.
- When you have more than 4 series, allow users to hide/unhide any series by clicking the legend
