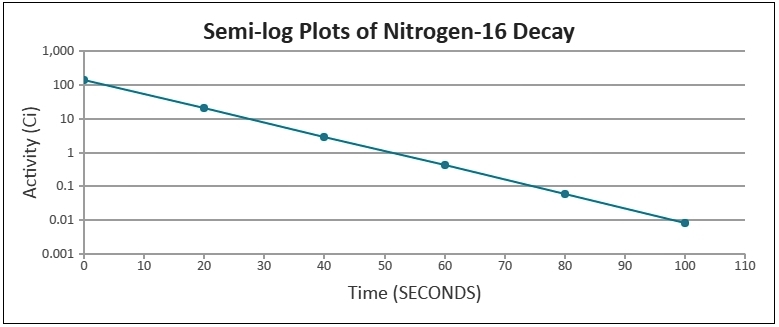
Today we are releasing 1.9.0 Beta 1 with Logarithmic Axis (supported in both X & Y Axis) which was one of the most requested features. This allows you to visualize data which changes by multiple orders in magnitude. You can also combine Linear and Logarithmic Scales to create Simi-Log Plots.
Below is an example & summary of the release
New Features & Enhancement
- Logarithmic Scale has been implemented in both X & Y Axis.
New Properties & Keywords
- logarithmic property (Boolean) to enable Log Scale on any Axis.
- logarithmBase property (Number) to choose the logarithm base.
You can see more examples of Logarithmic Charts in our Gallery.
Do download the latest version from our download page and let us know your feedback in the forum.
Thank You,
Sanjoy Debnath
Team CanvasJS
Leave a Reply