React Range Charts & Graphs
React Range Charts are visual representations that illustrate both high and low values simultaneously over a period of time. They're sometimes called Floating Charts because the plotted range appears to float within the given range rather than being fixed to a base. React Chart Component comes with varieties of range chart type such as Range Area, Range Column and Range Bar Charts.
In multi-series scenarios, React Chart Component seamlessly handles data from different series. In Range Column and Range Bar Charts, data points from distinct series are placed adjacent to each other & differentiated by series colors. For Range Area Charts, overlapping occurs based on the values represented, enhancing visual comprehension.
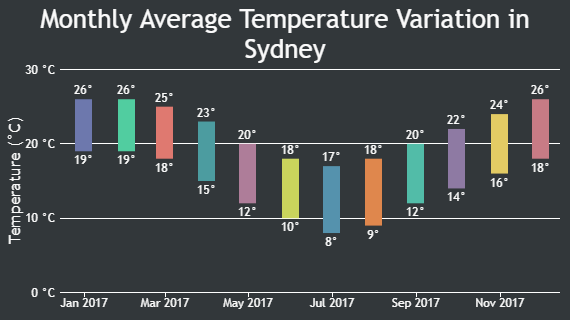
React Range Column Charts
Range Column Charts are also called Floating Column Chart as the columns are floating in given range instead of being attached to the base.
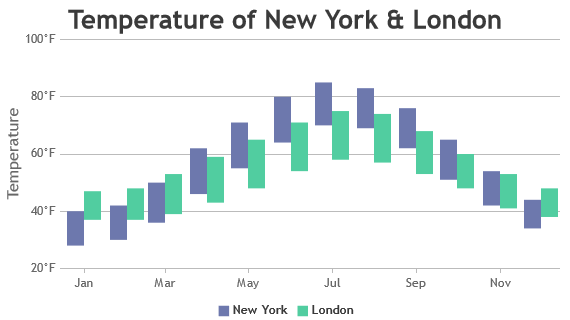
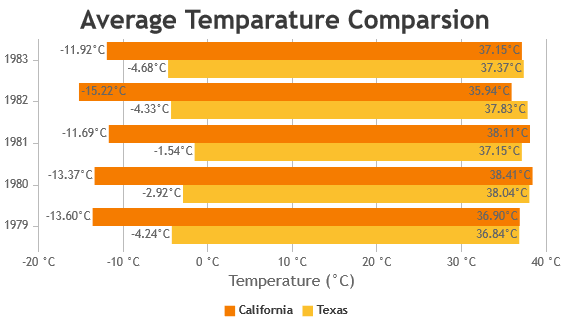
React Range Bar Chart
Range Bar Charts are similar to range column except that these are horizontally placed along with swapping x & y axis position.

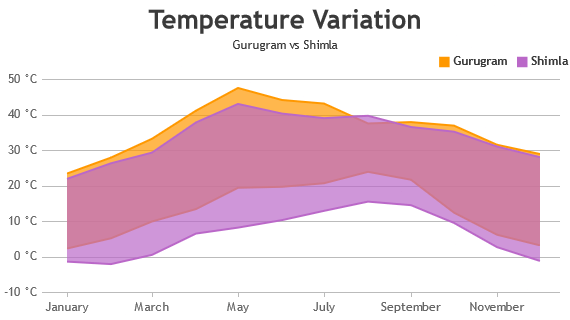
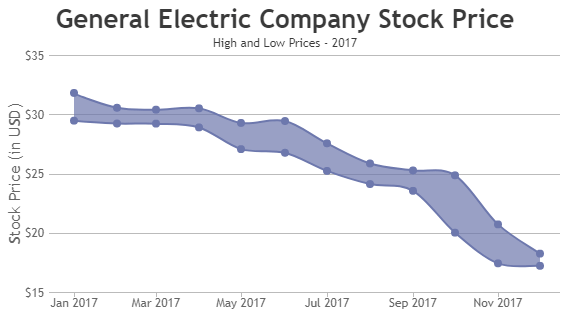
React Range Area Charts
React Range Area Chart is same as Area Chart except that it’s area is plotting between a given range.
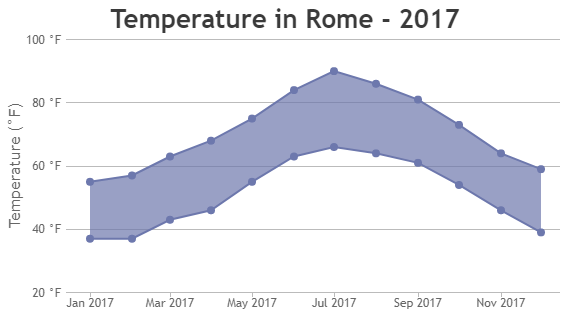
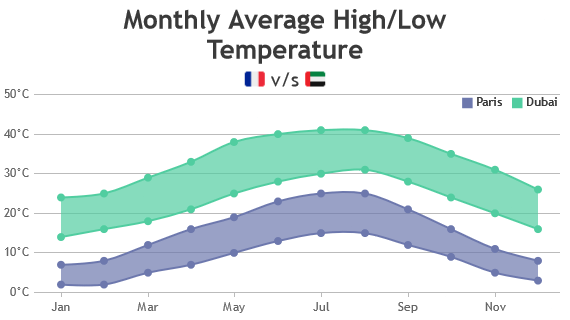
React Range Spline Area Charts
React Range Spline Area Chart is same as Range Area Chart except that it uses a smooth curve.
Features used Commonly in React Range Charts
Most commonly used in React Range Charts include color customization, opacity, animation, beveling the bars/columns.
- IndexLabels: You can display indexlabels to provide more context about the datapoint by setting indexLabel property.
- Animation: Enable animation for the chart by setting animationEnabled property to true.
- Bevel/Chisel: Set bevelEnabled property to true for bevel/chisel effect on each bar.
- Colors: Customize the color of datapoint using color property of the datapoint or by defining custom colorSet.
React Range Chart Types
General Tips for React Bar Charts
- Sort DataPoints: It is recommended to sort datapoints in ascending order of x values.
- Hiding/Showing DataSeries: When working with more than four series, provide users with the option to toggle the visibility of individual series by clicking on legend.