React Funnel & Pyramid Charts
React Funnel Charts offer a visual representation of data flow, where the widest section at the top signifies the initial stage, gradually narrowing down through subsequent sections. Funnel Charts are particularly effective for showcasing sales pipelines and website conversion rates, providing clear insights into data progression.
React Pyramid Charts, often called reverse funnels, display hierarchical data with the largest section at the bottom, progressively narrowing to smaller segments. Widely used in visualizing population demographics, organizational structures, and other hierarchical datasets, they offer clear insights into category breakdowns and proportional relationships.
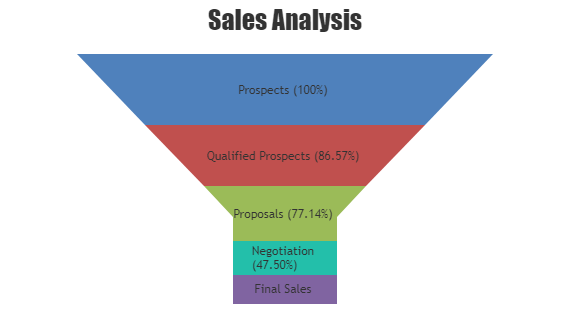
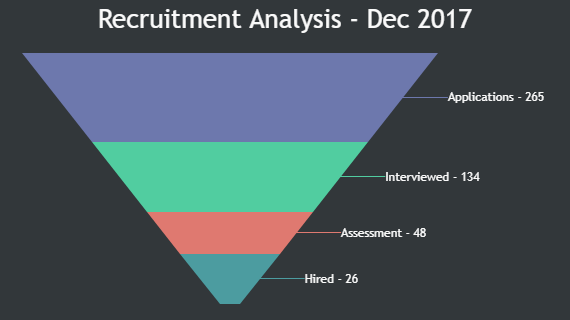
React Funnel Charts
Funnel charts display progressive decrease of data in hierarchical structure.
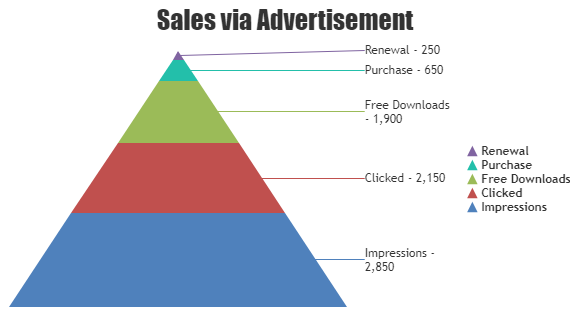
React Pyramid Charts
Pyramids are reversed funnel chart with no neck.
Features used Commonly in React Funnel & Pyramid Charts
Commonly used features in React Funnel & Pyramid includes value representation, exploding the section on click, neck width, etc.
- Reversed: Reversing the chart using the reversed property in funnel/pyramid chart can help enhance understanding of the final stages or result.
- Customizing Neck: Fine-tunning neck height and width using neckHeight & neckWidth properties respectively in funnel and pyramid charts improves the visibility and emphasis the critical final stages.
- Value Representation: valueRepresents property allows you to specify whether the values in Funnel or Pyramid Charts are proportional to the respective section’s height or area.
- Explode: explodeOnClick property lets you decide if a section of funnel/pyramid chart should explode when clicked, while the exploded property makes sections explode on initial render.
React Funnel & Pyramid Charts
General Tips for React Funnel & Pyramid Charts
- Limit the number of stages: The chart can get cluttered and challenging to read when there are too many sections; keeping it to 5-7 stages ensures optimal clarity.
- IndexLabel: Each section should be clearly labeled with the stage name and its corresponding value making it easier to understand the chart.