• Demos
    • JavaScript Charts
    • JavaScript StockCharts
  • Download/NPM
    • Download CanvasJS
    • Install via NPM
  • Integrations
    Front End Technology Samples
    • React Charts
    • Angular Charts
    • Vue.js Charts New!
    • jQuery Charts
    • Dashboards
    Server Side Technology Samples
    • PHP Charts
    • Python Charts New!
    • ASP.NET MVC Charts
    • Spring MVC Charts
    • JSP Charts
  • License
  • Blog
  • Docs
    • Chart Documentation
    • StockChart Documentation
  • Support Forum
    • Chart Support
    • StockChart Support
  • My Account
My Account
  • KEY FEATURES
    • Chart with Index / Data Label
    • Chart with Zooming / Panning
    • Chart using JSON Data
    • Chart with Animation
    • Multi Series Chart
    • Chart with Multiple Axes
    • Chart with Crosshair
    • Chart with Scale Breaks
    • Chart with Logarithmic Axis
    • Performance with 50,000 Data Points
    • Responsive Charts
    • Chart with Drilldown
  • LINE CHARTS
    • Line Chart with Formatted Axes Labels
    • Dashed Line Chart
    • Multi Series Line Chart
    • Spline Chart
    • Multi Series Spline Chart
    • Step Line Chart
    • Multi Series Step Line Chart
  • BAR CHARTS
    • Bar Chart with Category Axis
    • Multi Series Bar Chart
    • Stacked Bar Chart
    • Stacked Bar 100% Chart
    • Stacked Bar 100% Chart with Indexlabel
  • COLUMN CHARTS
    • Column Chart with Category Axis
    • Multi Series Column Chart
    • Stacked Column Chart
    • Stacked Column 100% Chart
    • Stacked Column 100% Chart with Indexlabel
    • Waterfall Chart
    • Waterfall Chart with Indexlabel
  • AREA CHARTS
    • Area Chart with Date-Time Axis
    • Multi Series Area Chart
    • Spline Area Chart
    • Multi Series Spline Area Chart
    • Step Area Chart
    • Stacked Area Chart
    • Stacked Area 100% Chart
  • RANGE CHARTS
    • Range Column Chart
    • Multi Series Range Column Chart
    • Range Bar Chart
    • Multi Series Range Bar Chart
    • Range Area Chart
    • Multi Series Range Area Chart
    • Range Spline Area Chart
    • Multi Series Range Spline Area Chart
  • PIE & DOUGHNUT CHARTS
    • Pie Chart with Indexlabels
    • Pie Chart with Index Labels Placed Inside
    • Doughnut Chart
    • Doughnut Chart in Dark Theme
  • FUNNEL & PYRAMID CHARTS
    • Funnel Chart
    • Funnel Chart with Custom Neck
    • Pyramid Chart
  • FINANCIAL CHARTS
    • Candlestick Chart
    • Candlestick Chart from JSON
    • OHLC Chart
    • OHLC with Trendline
    • Box and Whisker Chart
    • Box and Whisker Chart with Customization
  • BUBBLE & SCATTER CHARTS
    • Scatter Chart
    • Scatter Chart with Custom Markers
    • Bubble Chart
  • COMBINATION CHARTS
    • Error chart
    • Error Line Chart
    • Pareto Chart
    • Combination of Column, Line and Area Chart
  • DYNAMIC CHARTS
    • Dynamic Line Chart
    • Dynamic Column Chart
    • Dynamic Multi Series Chart
  • STOCKCHARTS
    • StockChart with Numeric Axis
    • StockChart with Date-Time Axis
    • StockChart with SplineArea & Range Selector
  • ANGULAR, VUE.JS, JAVASCRIPT, JQUERY
    • Angular Charts
    • Vue.js Charts
    • jQuery Charts
    • JavaScript Charts
  • SERVER SIDE TECHNOLOGIES
    • ASP.NET MVC Charts
    • PHP Charts
    • Python Charts
    • JSP Charts
    • Spring MVC Charts

React Financial & Advanced Charts

Download React Chart Samples
  • React Chart Samples
  • JavaScript Chart Samples
  • Angular Chart Samples
  • Vue.js Chart Samples
  • jQuery Chart Samples
  • PHP Chart Samples
  • Python Django Chart Samples
  • ASP.NET Chart Samples
  • JSP Chart Samples
  • Spring MVC Chart Samples
  • Dashboard Samples
  • JavaScript StockChart Samples

React Candlestick & OHLC charts display opening, closing, high, and low prices, making it easy to identify market trends and patterns. OHLC charts offer a detailed view of price movements over time, essential for spotting potential reversals.

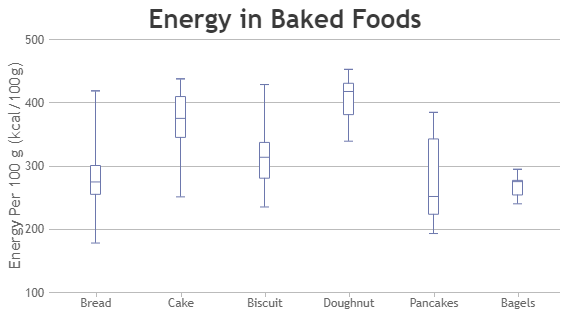
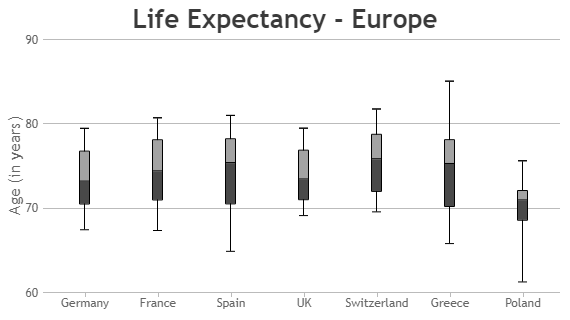
React Box & Whisker charts (box plots) summarizes data distribution, highlighting variability and outliers. Waterfall charts illustrate the cumulative effects of sequential values, making them perfect for visualizing financial statements and analyzing changes.

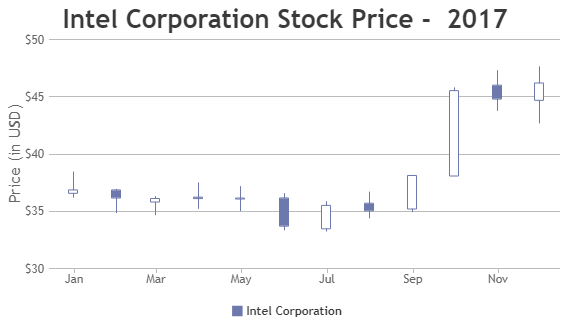
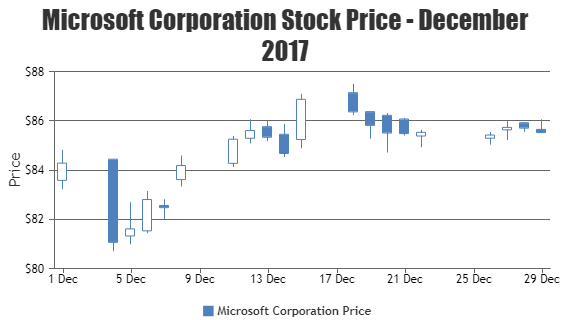
React Candlestick Charts

Candlestick Charts are generally used by traders to determine possible price movement based on past patterns.
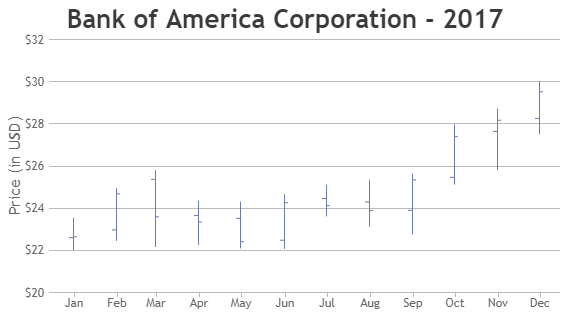
React Candlestick Chart
Candlestick Chart
React Candlestick Chart from JSON
Candlestick Chart from JSON

React OHLC Charts

OHLC Charts is a style of financial chart describing open, high, low & closing price of the stock.

React OHLC Chart
OHLC Chart
React OHLC Chart with Trendline
OHLC Chart with Trendline

React Box & Whisker Charts

Box & Whisker Chart are also referred as Box Plot.

React Box & Whisker Chart
Box & Whisker Chart
React Box & Whisker Chart with Customization
Box & Whisker Chart with Customization

Features used Commonly in React Financial & Advanced Charts:

Most commonly used features in React Financial Chart includes zooming, panning, customizing rising & falling colors, annotations, etc.

  • Zooming and Panning: You can interact with charts by zooming in and out or panning across time periods to get detailed views of specific data ranges.
  • Rising & Falling Colors: You can customize colors for rising and falling prices to enhance visual clarity and quick data interpretation.
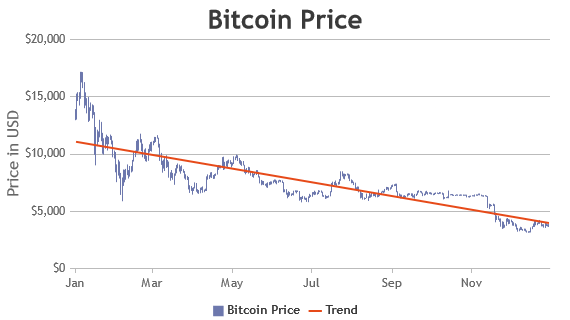
  • Indexlabels / Annotations: You can add Indexlabel that allows you to add text (including unicode characters) to the chart to provide additional context or highlight specific datapoint. Also, you can show trendlines to highlight patterns.

React Financial & Advanced Chart Types:

  • React Candlestick Chart
  • React OHLC Chart
  • React Box & Whisker Chart

General Tips for React Financial & Advanced Charts:

  • Use Annotations: Use annotations sparingly to highlight key trends without cluttering the chart.
  • User Interaction: Enhance user experience by enabling interactive features like zooming, panning and tooltip.

Quick Links

  • Chart Docs
  • StockChart Docs
  • About Us
  • FAQs

Server Side Technologies

  • ASP.NET MVC Charts
  • PHP Charts
  • JSP Charts
  • Spring MVC Charts

Front Side Technologies

  • JavaScript Charts
  • jQuery Charts
  • React Charts
  • Angular Charts
  • JavaScript StockCharts

Contact

  • Fenopix, Inc.
  • 2093 Philadelphia Pike,
  • #5678, Claymont,
  • Delaware 19703
  • United States Of America

©2025 Fenopix Privacy Policy Cookies Policy Careers