React Dynamic / Live Charts
React Dynamic Charts is an interactive chart that updates in real-time reflecting the changes in the incoming data. They are also referred to as Real-Time Charts or Live Charts. These charts allow for real-time monitoring of data streams such as stock prices, live sports scores, or sensor readings from IoT devices. React Dynamic Charts update without the need to refresh the page.
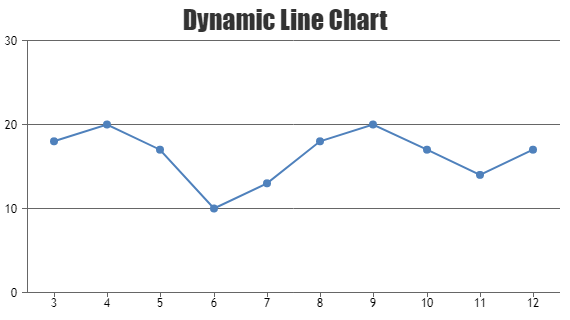
React Dynamic Charts
React Dynamic Charts are also referred to as Realtime / Live Charts.
Features Commonly used in React Dynamic Charts
Commonly used features used in React Dynamic Charts includes adding datapoints, dataseries, updating the chart options using setters, etc.
- Adding DataPoints/DataSeries: addTo method is used to add new datapoints/dataseries to the chart.
- Updating Chart options: Update chart options like chart type, themes, culture using chart.options followed by calling render method to reflect the changes.
- Getter & Setter: get method can be used to retrieve the value of property while set method lets you assign new value to property without the need to call render method.
General Tips for Improving the Performance of React Dynamic Charts
- Updating Datapoints Efficiently: Avoid re-creating the chart for each new data point. Instead, update the datapoints array and call the chart’s render() method at the end.
- Optimize Rendering: When adding multiple data points using the addTo method, optimize performance by rendering the chart only once. Set the updateChart parameter to false for all data points except the last one. This prevents unnecessary re-renders, improving the responsiveness of your application