React Scatter Charts & Bubble Charts
React Scatter Charts are used to represent quantitative data through markers. They are also referred to as Scatter Plot or Point Chart. A marker is drawn at each point and its shape and size can be customized as required.
React Bubble Chart allows you to visualize data in 3 dimensions. Similar to Scatter Chart, the x and y parameters determine the bubble's position on X and Y Axis respectively. However, the size of the marker depends on the third parameter z. One major difference in bubble from other charts is that size of the bubble is not linearly proportional to the z value.
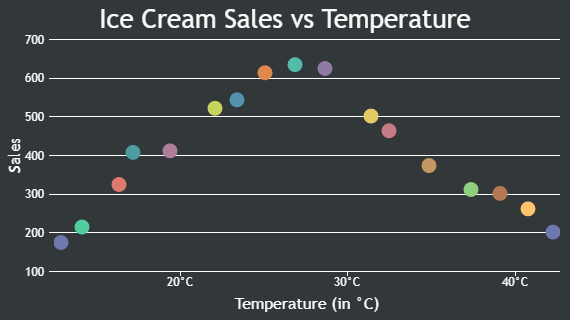
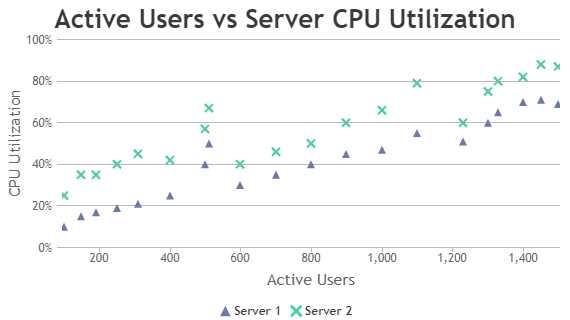
React Scatter Charts
Scatter Charts are also referred to as Scatter Plot / Point Chart.
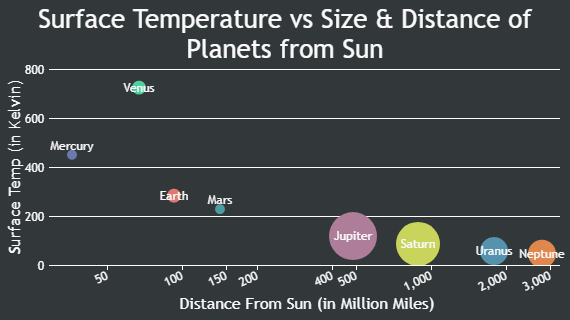
Bubble Charts
Bubble Chart uses bubble-like symbols to depict data in the Plot Area.
Features used Commonly in React Bubble & Scatter Charts:
Most commonly used features in React Bubble & Scatter Charts include indexLabel, markers, colors, etc.
- Index Label: Indexlabels can be placed over individual datapoints, making the chart more readable.
- Marker Types: Markers can be customized using markerSize, and markerType properties.
- Color: Color for dataseries can be set when multiple dataseries are plotted on the chart, using color property.
React Bubble & Scatter Chart Types
General Tips for React Bubble & Scatter Charts
- Limit Number of Datapoints: Bubble charts should be used when the number of datapoints are less, else it can lead to congestion and overlapping in the chart.
- Choose the right chart type: Scatter charts are ideal for displaying relationships between two continuous variables, while bubble charts can accommodate an additional dimension, usually represented by the size of the bubbles.
- Label important data points: Labeling specific data points can help users identify key insights or outliers in the chart.