React Line Charts & Graphs
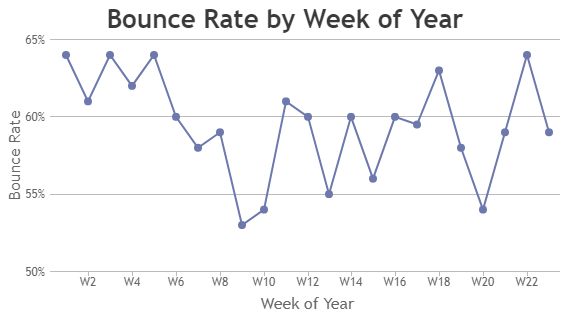
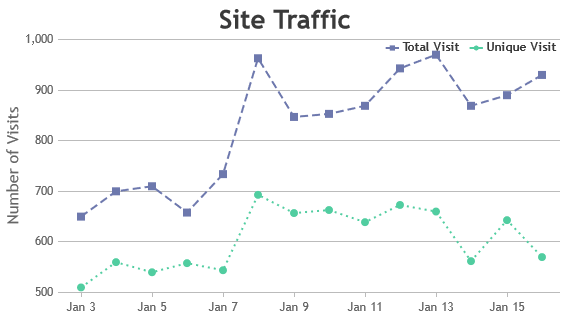
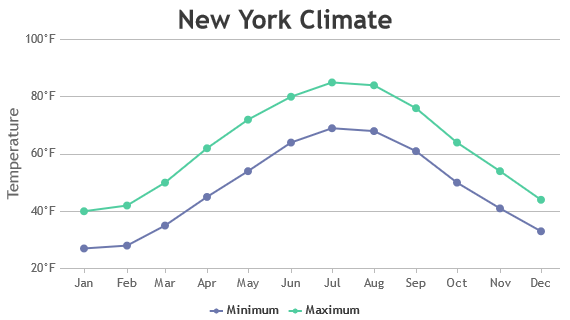
React Line Charts display information as a series of data points connected by straight lines. Line Charts are commonly used to illustrate trends and patterns over time or for comparing two different datasets, showing how values change in relation to one another. React Component lets you create Line, Spline (Smooth Line) or Step Line (Staircase Shaped) Charts by changing type property in dataseries.
Line chart comes with customizable features to tailor the axis scale appearance by modifying parameters like interval, ticks, labels, etc. Markers and symbols can be strategically utilized to highlight significant datapoints or trends, while support for multiple dataseries enables effortless comparisons between different datasets within the same chart.
React Line Charts
Line Charts (also referred as Line Plot or Line Graph) are drawn by connecting adjacent datapoints with a straight line.
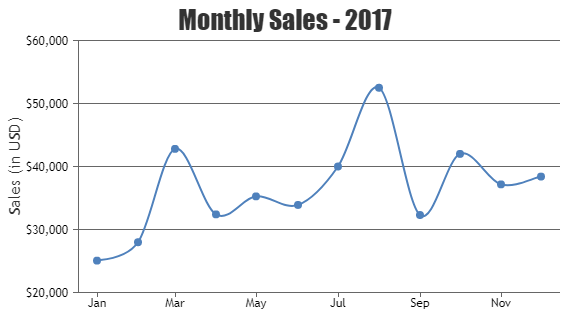
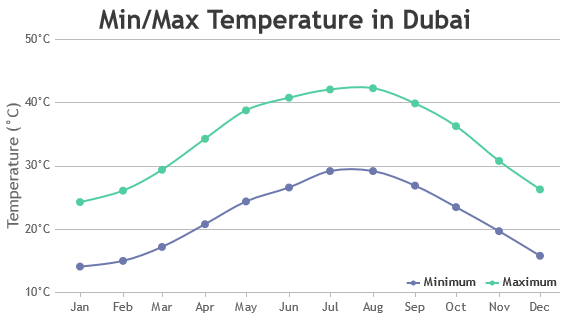
React Spline Charts
Spline Charts are also called as Smooth Curved Line Chart as the line connecting datapoints have smooth curves.
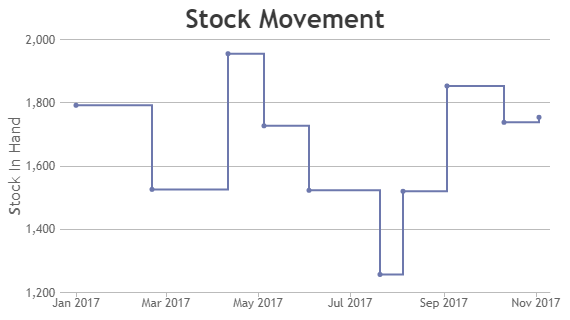
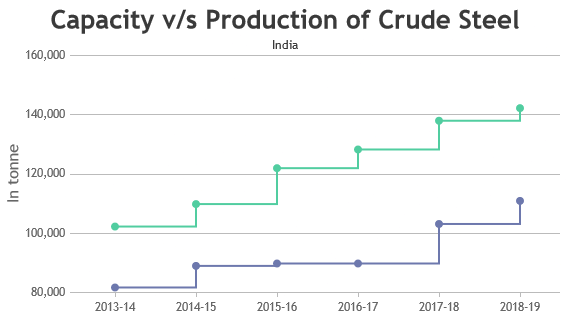
React Step Line Charts
Step Line Charts are also known as step charts & sometimes staircase chart because of it’s shape.
Features used Commonly in React Line Chart
Most commonly used features in React Line Chart includes zooming, panning, customizing color, thickness & dash-type of the line, annotations, etc.
- Zooming and Panning: You can zoom in and out of the chart or pan across different sections of the data for detailed analysis. This feature can be enabled by setting zoomEnabled property to true.
- Line Styles: Customize the appearance of lines by changing lineColor, lineThickness and lineDashType to differentiate between multiple dataseries.
- Indexlabels / Annotations: Indexlabel allows you to add text or shapes to the chart to provide additional context or highlight specific datapoint.
- Tooltip: Interactive tooltips provide additional information about datapoints when users hover over them, aiding in data interpretation.
How to Improve Performance of React Line Chart?
Typically, React Line Charts perform well with default settings when you have up to 100,000 data points. However, if you are facing any issues with performance, there are few tweaks that you can do in order to make the chart render faster.
- Reduce Data Points: Limit the number of datapoints displayed, especially if you’re dealing with large datasets. You can aggregate or down-sample data to reduce the number of points while maintaining the overall trend.
- Avoid Markers: Avoid showing markers for all the datapoints if the dataset is large. Not only does it clutter the chart visually, but it also slows down rendering.
- Optimize Tooltip Content: Keep tooltip content lightweight with essential information only. Complex calculations or data processing in tooltips can impact performance, especially with a large number of data points.
React Line Chart Types
General Tips for React Line Charts
- Use Multiple Axes: If you are rendering multiple series with different range of values, it is better to use a different Axis for each series.
- Limit the Number of Datapoints: Too many datapoints can clutter the chart and make it difficult to interpret. Consider aggregating or sampling data wherever possible to display effectively.
- Interactivity: Enhance user engagement with interactive features like tooltips, zooming and panning, allowing users to explore data in-depth.
