Login to Ask a Question or Reply
Forum Replies Created by Vishwas R
-
Please take a look at this jsfiddle.
I suggest you to refer MDN Documentation for more info on JavaScript related queries / tutorials.
—
Vishwas R
Team CanvasJSIn the jsfiddle that you have shared y-values passed to the dataPoints are string. Y-values in dataPoints can accept numeric values only. Changing it to numeric should work fine in your case. Please take a look at this updated jsfiddle.
—
Vishwas R
Team CanvasJSAugust 10, 2018 at 6:01 pm in reply to: Doughnut Chart for ReactTable Each cell as different values #22206August 10, 2018 at 4:41 pm in reply to: Doughnut Chart for ReactTable Each cell as different values #22201You can render chart inside a table row/cell. Please take a look at this jsfiddle.
—
Vishwas R
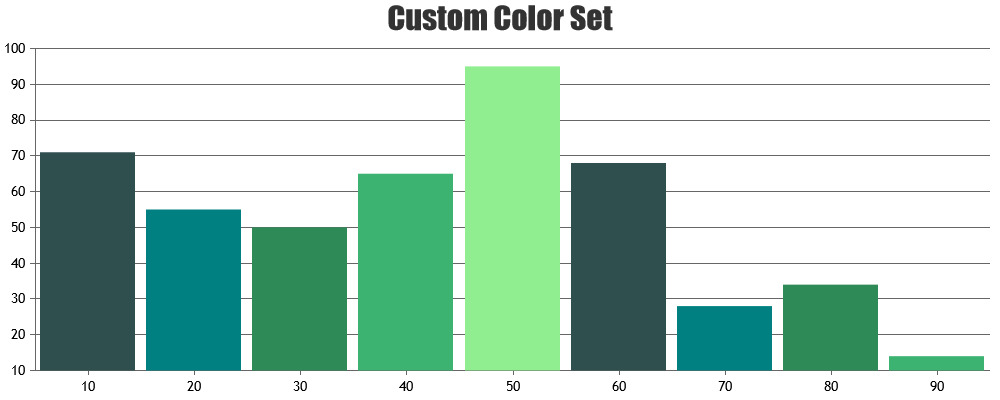
Team CanvasJSAugust 10, 2018 at 2:34 pm in reply to: How to set the label and bar color based on the array value #22194Shift is a JavaScript array method that removes the first item of an array. Please refer this link for more info on the same. Please refer our documentation for complete step-by-step tutorial on creating dynamic charts.
—
Vishwas R
Team CanvasJSLegends will be shown for every dataSeries. You can enable legend by setting showInLegend property in dataSeries level to true. Text shown in legend can be set with the help of name or legendText.

—
Vishwas R
Team CanvasJSYou seemed to be using chart within getData method but which is undefined as its not passed when the function is called. Passing chart as parameter to getData method should work fine in your case
getData(chart);.It would be helpful for us to understand your scenario better when we look at your code working live in jsfiddle. So I kindly request you to create jsfiddle and share it with us if you find any issue working in CanvasJS in future.
—
Vishwas R
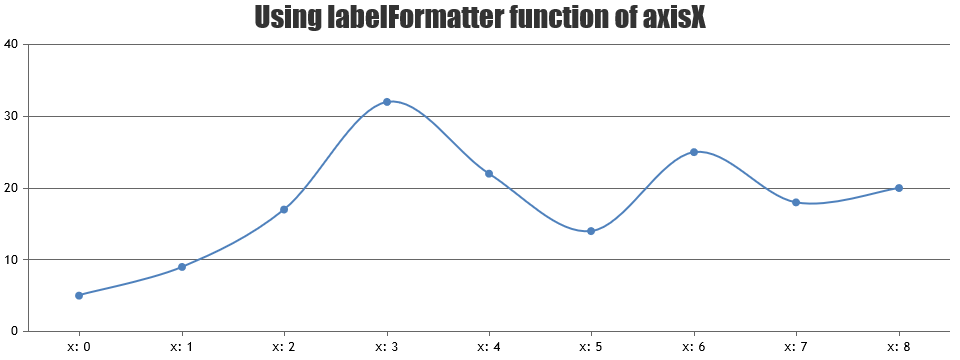
Team CanvasJSvalueFormatString is used to format numbers and date time values (x-values) that appears on axisX but not for labels. Passing x-value to dataPoints should work fine in your case
dps.push({"x":new Date(result[i].time), "y":result[i].humidity});.To format labels, you can use labelFormatter.
—
Vishwas R
Team CanvasJSAugust 9, 2018 at 9:34 am in reply to: I would like to build a draggable column charts side by side in a row. #22168Please take a look at an gallery example on Chart Data from Database for rendering chart in PHP with data from mysql database. You can also download PHP Samples from our download page for more working examples in PHP.
—
Vishwas R
Team CanvasJSCan you kindly share sample project along with sample database over Google-Drive or Onedrive so that we can look at your code, understand it better and help you out?
—
Vishwas R
Team CanvasJSX-Value can be numeric or date-time. But in the dataPoints that you are passing x-values are string. Changing ‘x’ to label, i.e.
[{"y":1,"label":"model3"},{"y":1,"label":"model4″},{"y":1,"label":"model1"},{"y":1,"label":"model2"}]should work fine.—
Vishwas R
Team CanvasJS