Login to Ask a Question or Reply
Forum Replies Created by Vishwas R
-
October 18, 2018 at 6:43 pm in reply to: how can i get the max, min, avg and current value of any multi series chart #23114
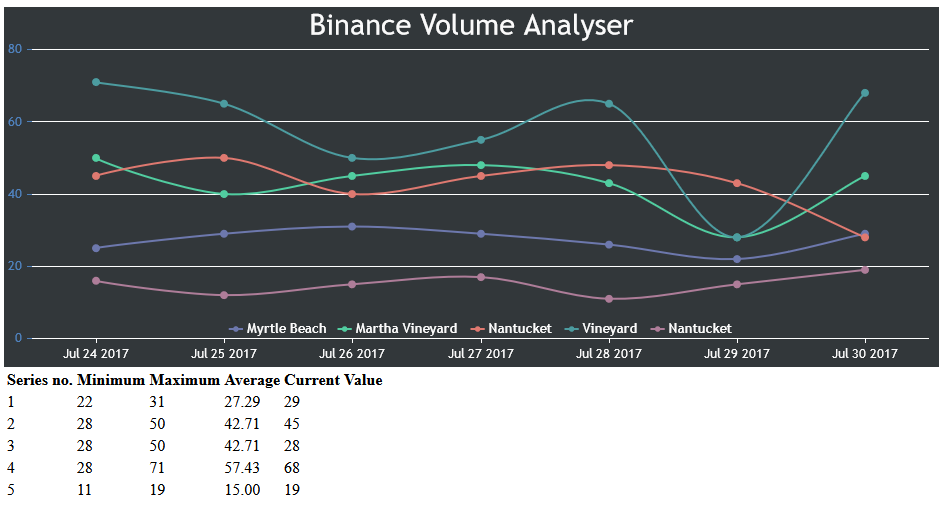
You can loop through dataPoints of all the series to calculate the minimum, maximum & average values. Please find the code snippet below.
function performCalculations(dataPointValue, currentValue, seriesIndex) {
  sum = 0;
  for( var j = 0; j<dataPointValue.length; j++ )
    sum = sum - (-dataPointValue[j]);
  average = sum / dataPointValue.length;
  seriesIndex = seriesIndex + 1;

  $("tr:eq("+seriesIndex+") #td" + 0).html(seriesIndex)
  $("tr:eq("+seriesIndex+") #td" + 1).html(Math.min.apply(null, dataPointValue))
  $("tr:eq("+seriesIndex+") #td" + 2).html(Math.max.apply(null, dataPointValue))
  $("tr:eq("+seriesIndex+") #td" + 3).html(average.toFixed(2))
  $("tr:eq("+seriesIndex+") #td" + 4).html(currentValue)
}
Please take a look at this JSFiddle for complete code.
—
Vishwas R
Team CanvasJSThe project the you have shared doesn’t seem to have CanvasJS Charts in it. If you are looking for rendering chart with data from database in PHP, please take a look at gallery example on PHP Chart Data from Database. You can also download PHP samples (which includes reading data from database) from our download page and run it locally.
If you are still facing any issue, please create sample project reproducing the issue and share it with us so that we can look into your code, understand it better and help you out.
—
Vishwas R
Team CanvasJSOctober 18, 2018 at 9:49 am in reply to: can we get series minimum and maximum value of datapoints #23110How could I update the crosshair?
It would be helpful for us to understand your scenario better when we look at working code live in JSFiddle than guessing the issue by looking at screenshot. I request you to create JSFiddle reproducing the issue and share it with us.
I also thought about erasing the last datapoint and adding the new one, but I did not find the instructions to erase a datapoint. Can you give some solution?
Datapoints is an array. So you can remove last dataPoint using either pop method or splice method.
—
Vishwas R
Team CanvasJSMaksim,
Updating the width of image on resizing the window should work fine in your case. Please take a look at this updated JSFiddle.
—
Vishwas R
Team CanvasJSdataPoints can accept
[{"x": 1, "y": 23},...]or labels and few other properties like indexLabel, color, etc and not as id and temp. Changing$point = array("id" => $row['id'] , "temp" => $row['temp']);to$point = array("x" => $row['id'] , "y" => $row['temp']);in data.php should work fine in your case. Please download the updated sample code here.—
Vishwas R
Team CanvasJSMaksim,
If you are trying to add background image to chart, you can add background-image to the chart-container and set chart backgroundColor to transparent. Below is the code-snippet.
<div id="chartContainer" style="height: 300px; width: 100%; background-image:url('https://canvasjs.com/wp-content/uploads/2021/03/background-image-for-chart.jpg');"></div>Please take a look at this JSFiddle for complete code.
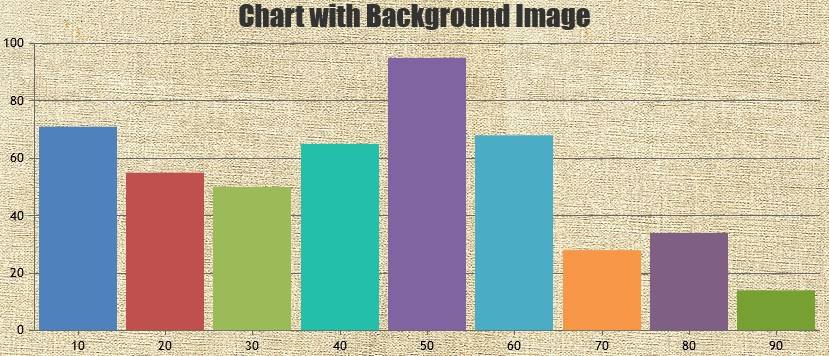
Or if you like to position image on-top of chart with defined width and position, you can add image and position with the help of CSS properties as shown in this tutorial.
—
Vishwas R
Team CanvasJSSorry, adding space in indexLabel or margin / padding to the indexLabel is not possible as of now.
—
Vishwas R
Team CanvasJSYou can format x-value and y-value displayed in toolTip / indexLabel by setting xValueFormatString and yValueFormatString respectively whereas valueFormatString just defines the format of axis-labels.
xValueFormatString: "HH:mm",
yValueFormatString: "#,###.##"
—
Vishwas R
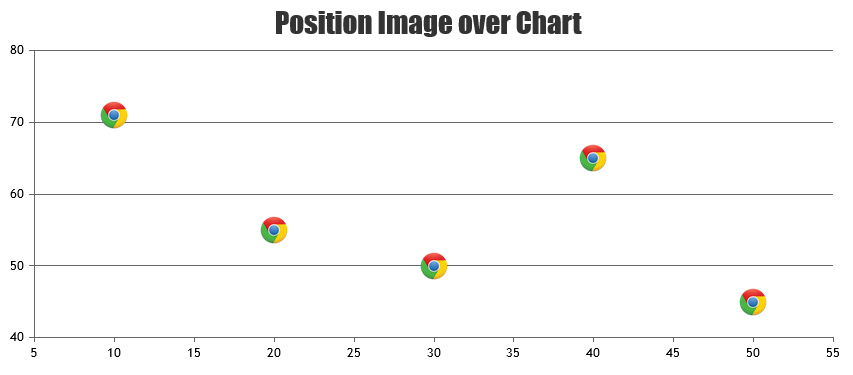
Team CanvasJSYes, you can position the image over chart and make it responsive by using convertValueToPixel method. Below is the code-snippet for the same.
$('img').attr('src', url)
	.attr("class", label)
	.css({"display": "none"})
	.appendTo($('#chartContainer>.canvasjs-chart-container'));

imageBottom = chart.axisX[0].bounds.y1;
imageCenter = chart.axisX[0].convertValueToPixel(chart.data[0].dataPoints[0].x);

image.css({"position": "absolute", "display": "block", "top": imageBottom  - fruit.height(), "left": imageCenter - fruit.width()/2 });
Please take a look at this documentation page for step-to-step tutorial on positioning image on top of chart.
Also refer to this JSFiddle for an example.
—
Vishwas R
Team CanvasJSPlease refer documentation of itemClick for attaching click event to legend items. It gives event-object with chart, dataPoint, dataSeries, etc as parameters. Using e.dataSeries.name you can get the name of the legend item (if name is set for that dataSeries).
If you are still facing the issue, kindly create JSFiddle reproducing the issue you are facing so that we can look into your code, understand the issue better and help you out.
—
Vishwas R
Team CanvasJSOctober 11, 2018 at 12:03 pm in reply to: How to preserve zeros after decimal point in tooltip? #23010formatNumber accepts optional culture parameter aswell. If you like to use contentFormatter and apply cultureInfo, you can pass the culture to formatNumber and format according to your requirements. Please take a look at this updated JSFiddle.
—
Vishwas R
Team CanvasJSWith the help of Equation of Straight Line, you can detect if a point lies on the line or not. Please take a look at this JSFiddle.
Also, please refer this stackoverflow thread for more info on achieving the same in JavaScript.
—
Vishwas R
Team CanvasJS1.can we place stripline label (on Y-axis) by labelPlacement:”outside” to Right side. like attached image? now if we apply outside it is going to axisY (left side)— imageUrl – https://imgur.com/a/5Cq1x49
You can attach stripLine to secondary axisY (axisY2) to show labels towards right of the chart. Please take a look at this JSFiddle.
2.how can we implement tooltip on stripline label?
Tooltip to stripline label is not possible as of now.
—
Vishwas R
Team CanvasJSBy setting gridThickness to 0, you can get rid off grids and either by setting labelFontSize to 0 or with the help of labelFormatter you can remove axis labels. Please take a look at this JSFiddle.
—
Vishwas R
Team CanvasJSOctober 10, 2018 at 11:07 am in reply to: How to preserve zeros after decimal point in tooltip? #22989Tooltip’s contentFormatter overrides the culture-info in the JSFiddle that you have shared. Instead you can use toolTipContent in dataSeries to customize the toolTip content and apply culture aswell. Please take a look at this updated JSFiddle.
—
Vishwas R
Team CanvasJS