Login to Ask a Question or Reply
Forum Replies Created by Vishwas R
-
May 22, 2019 at 2:16 pm in reply to: unable to display background image on a canvas js template #25257
Please take a look at this JSFiddle for an example on adding background image to chart.
If you are still facing any issue, kindly create JSFiddle reproducing the issue you are facing and share it with us so that we can look into the code, understand the scenario better and help you out.
—
Vishwas R
Team CanvasJSTurgut,
You can customize the position of export button by applying styling to ‘canvasjs-chart-toolbar’ class. Please take a look at this JSFiddle.
—
Vishwas R
Team CanvasJSYou can achieve this by programmatically clicking the zoom button (which switches to pan mode) upon rendering the chart. Please take a look at this JSFiddle for the same.
Considering this as duplicate of set default viewport property of a chart to pan, hence closing the same.
—
Vishwas R
Team CanvasJSYou can achieve this by programmatically clicking the zoom button (which switches to pan mode) upon rendering the chart. Please take a look at this JSFiddle for the same.
—
Vishwas R
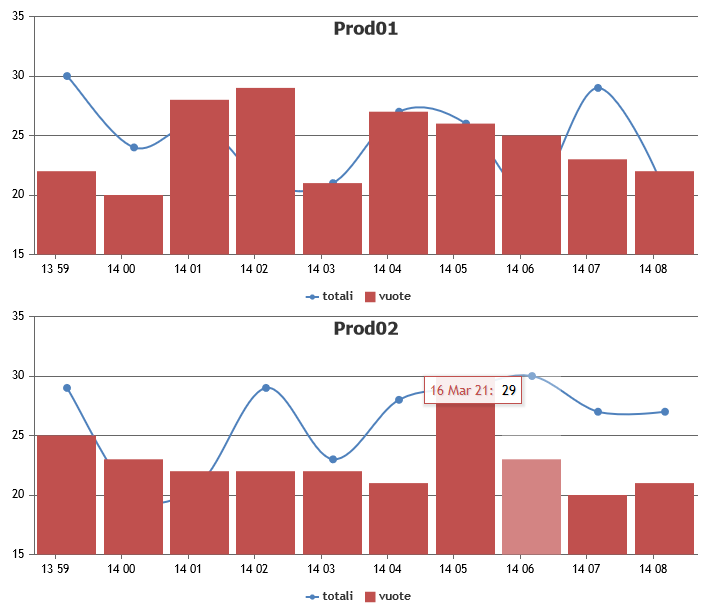
Team CanvasJSMay 15, 2019 at 5:13 pm in reply to: Single legend heading for multiple charts in the same page #25192Single legend to multiple charts is not available, as of now. However you can achieve the same by disabling legends for all the charts except the one at the bottom / last chart and handle hiding / unhiding of dataSeries of all charts from the shown legend. Please take a look at this JSFiddle for a demo. Same code works fine even in Angular, React and other frameworks.
If this doesn’t fulfill your requirement, kindly share JSFiddle with your use-case with us, so that we can look into code, understand the scenario better and help you out.
—
Vishwas R
Team CanvasJSYou seemed to be interchanging the x and y values which assigning it. Passing ‘DateTime’ to x and ‘Count’ to y should work fine in your case. Please take a look at this updated code.
—
Vishwas R
Team CanvasJSI observe that you are performing AJAX request inside AJAX request within which you are creating chart (i.e. a new chart is created every 500ms). Instead, you can create chart once, update dataPoints every 500ms and re-render the chart. Please take a look at this updated code sample.

—
Vishwas R
Team CanvasJSSorry, highlighting the the filled area on selection is not possible as of now. However with the help of stripLines, you can highlight the entire section as shown in this sample project.
—
Vishwas R
Team CanvasJSMay 7, 2019 at 5:28 pm in reply to: Issue with combined chart types, multiple axis and shared tooltip. #25092Thanks for reporting the use-case, we will improve this behavior in future releases. You can work-around this issue by assigning all series to primary x-axis and using contentFormatter as shown in this updated pen.
—
Vishwas R
Team CanvasJS@wm,
It seems to be working fine. Please check this sample project in react-native, in which font-size of axisX labels is set to 25.
Can you kindly share sample project reproducing the issue you are facing along with the browser / steps that you used for the same, so that we can run it at our end, understand the issue better and help you out?
—
Vishwas R
Team CanvasJSThe sample shared demonstrates an approach to achieve draggable chart with single dataSeries. However changing the logic to make it work with multi-series chart should work fine in this case.
—
Vishwas R
Team CanvasJS-
This reply was modified 5 months, 1 week ago by
Manoj Mohan.
You can use stripLines to highlight the area according to your requirements.
—
Vishwas R
Team CanvasJS -
This reply was modified 5 months, 1 week ago by