Home › Forums › Chart Support › Average line on line chart

Average line on line chart

Viewing 4 posts - 1 through 4 (of 4 total)
  • #7226

    I’m trying to add an average line which is an average of all the other lines on a chart, and while I could do this server side, I was wondering if there was an easy way to do this in canvasjs. This is my current chart http://jsfiddle.net/txcsLgad/1/

    • This topic was modified 11 years, 11 months ago by zachary.
    #7384

    There is no way to do this automatically. Best option is to calculate the averages either on the server (or client side) and adding it to the chart.

    —
    Sunil Urs

    #18860

    Hello Sir,

    I need to make moving average for a week with column and bar chart. Data should show in Column chart and moving average of two points for 7 days data should be by line chart on bar chart. Please HELP by giving a example.

    Regards

    #18878

    @nisha,

    You can calculate simple moving average(SMA) by writing few lines of code and pushing the respective values to dataSeries will render the chart with SMA series. Please take a look at the below code snippet for calculating 7 Day SMA and pushing it to chart dataSeries.

    function calculateMovingAverage(chart) {
      var numOfDays = 7;
      // return if there are insufficient dataPoints
      if(chart.options.data[0].dataPoints.length <= numOfDays) return;
      else {
        // Add a new line series for  Moving Averages
        chart.options.data.push({
          type: "spline",
          markerSize: 0,
          name: "SMA",
          yValueFormatString: "#,##0.00",
          dataPoints: []
        });
        var total;
        for(var i = numOfDays; i < chart.options.data[0].dataPoints.length; i++) {
          total = 0;
          for(var j = (i - numOfDays); j < i; j++) {
            total += chart.options.data[0].dataPoints[j].y;
          }
          chart.options.data[1].dataPoints.push({
            x: chart.options.data[0].dataPoints[i].x,
            y: total / numOfDays
          });
        }
      }
    }

    Also, Please have a look at this JSFiddle for complete code.
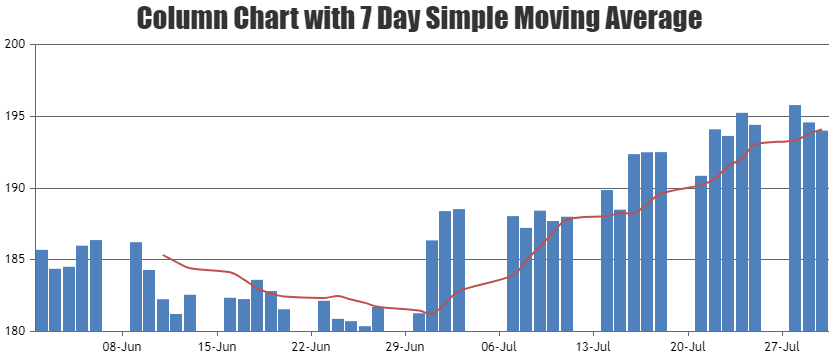
    Column Chart with 7 Day Simple Moving Average

    ___
    Suyash Singh
    Team CanvasJS

Viewing 4 posts - 1 through 4 (of 4 total)

You must be logged in to reply to this topic.