Login to Ask a Question or Reply
Forum Replies Created by Rohith Nagaral
-
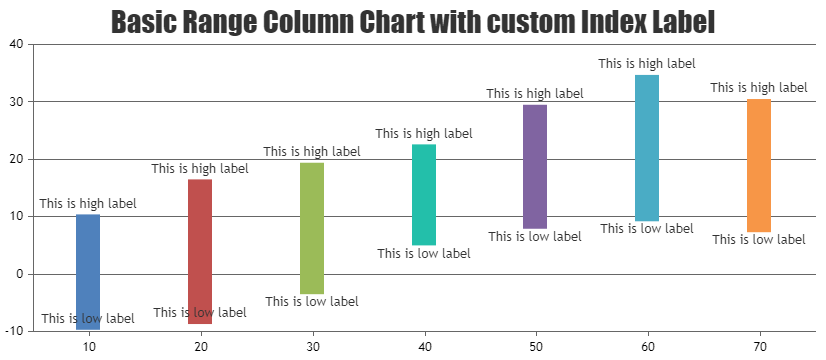
It is not possible to customize both the upper and lower index labels differently, But it is possible to customize both the index labels with the same indexLabelFontFamily and indeLabelFontColor
—
Rohith Nagaral
Team CanvasJSYou can use indexLabelFormatter to show custom index labels as shown in the code snippet below.
indexLabelFormatter: function(e){
    if( e.index === 1)
     return "This is high label";
    else
     return "This is low label";
},
Please check this JSFiddle for an example of the same.
—
Rohith Nagaral
Team CanvasJSNovember 8, 2023 at 6:49 pm in reply to: How Can I make CanvasJS Charts the Correct Width When Printing? #44036You can change the width / height or both as per your requirements only while printing using media queries. Please take a look at the code-snippet below.
@media print {
  .canvasjs-chart-canvas {
    width: 300px !important;
  }
}
__
Rohith Nagaral
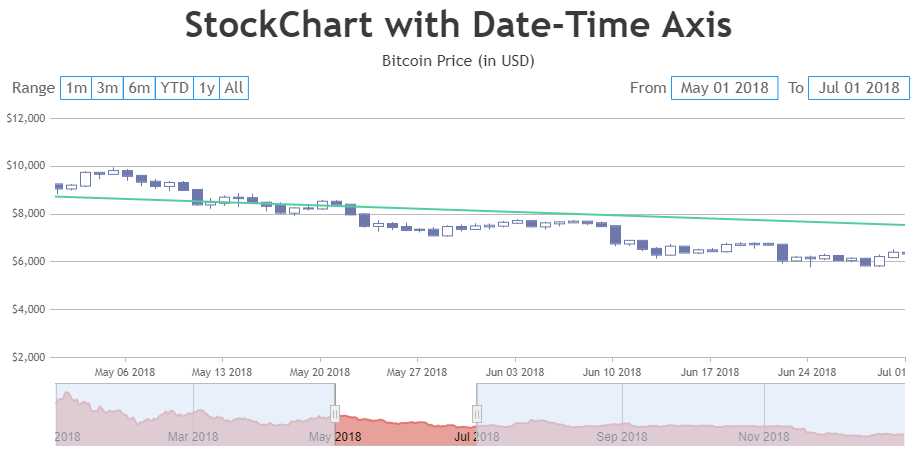
Team CanvasJSIt is not possible to show ticks at custom intervals as of now. However, you can use stripLines on axisX for displaying labels at certain points as shown in this JSFiddle.
__
Rohith Nagaral
Team CanvasJSIn line charts, markers are automatically disabled when there are large number of datapoints. You can override this behaviour by manually setting markerSize to a value greater than zero.
__
Rohith Nagaral
Team CanvasJS1) lack of line continuity through additional points on the chart:
Can you please brief us more about your query, so that we can understand it better and help you out. Also, it would be great if you could create a jsfiddle reproducing the issue that you are facing so that we can look into it and help you out.
2) Date range problem. The chart shows data from February 5, 2023 to May 28, 2023. The data is from January 5, 2023 to April 28, 2023. It turns out that there is a shift in the chart of + 1 month in relation to the input data
CanvasJS is a JavaScript library and follows JavaScript Date-Formats where month starts from 0(January) and ends at 11(December). However, you can use ISO format to pass month from 1 to 12 (Example: “2015-03-25” is considered as March 25, 2015).
__
Rohith Nagaral
Team CanvasJSDoughnut charts with spacing between slices and rounded edges are not available as of now.
__
Rohith Nagaral
Team CanvasJSGraham Madders,
Thanks for your feedback. This feature is there in our wishlist but no definite timeline yet.
__
Rohith Nagaral
Team CanvasJSYou can set the font size of the data-label (indexLabel) by setting indexLabelFontSize property.
If this does not meet your requirement, kindly brief us further with a pictorial representation or an example so that we can understand your requirement better and suggest an appropriate solution.
__
Rohith Nagaral
Team CanvasJSThe color property accepts RGB, hex-code, and color-names as of now. However, you can get CSS variable value in JavaScript using getComputedStyle() as shown in the code snippet below.
function getCSSVarValue(name) {
    return getComputedStyle(document.getElementById('chartContainer')).getPropertyValue(name);
  }
Please check this JSFiddle for a working example.
__
Rohith Nagaral
Team CanvasJS