Login to Ask a Question or Reply
Forum Replies Created by Priyanka M S
-
Himanshu,
In the fiddle you have provided, the spacing on left and right of chart is because of the x values you provide to axisX. By setting appropriate minimum and maximum values, you can reduce the spacing. Please take a look at this updated jsfiddle.
__
Priyanka M S
Team CanvasJSCan you kindly share a sample project along with sample database over Onedrive or Google-Drive, so that we can look into your code, understand it better and help you out?
__
Priyanka M S
Team CanvasJSThe above code seems to be working fine (along with XAMPP), if Y values –
$f_1[0]are defined. Please take a look at the sample code below.<?php $f_1 = array(192, 168, 100); $f_2 = array(80, 100, 150); $f_3 = array(120, 80, 120); $f_4 = array(100, 200, 300); $dataPoints = array( array("label"=> "TPV 1", "y"=> $f_1[0]), array("label"=> "TPV 2", "y"=> $f_2[0]), array("label"=> "TPV 3", "y"=> $f_3[0]), array("label"=> "TPV 4", "y"=> $f_4[0]) ); ?> <!DOCTYPE HTML> <html> <head> <script> window.onload = function () { var chart = new CanvasJS.Chart("chartContainer", { animationEnabled: true, theme: "light2", // "light1", "light2", "dark1", "dark2" title:{ text: "Datos de Ventas" }, axisY: { title: "Cantidad" }, data: [{ type: "column", showInLegend: true, legendMarkerColor: "grey", legendText: "leyenda", dataPoints: <?php echo json_encode($dataPoints, JSON_NUMERIC_CHECK); ?> }] }); chart.render(); } chart.render(); </script> </head> <body> <div id="chartContainer" style="height: 370px; width: 100%;"></div> <script src="https://cdn.canvasjs.com/canvasjs.min.js"></script> </body> </html>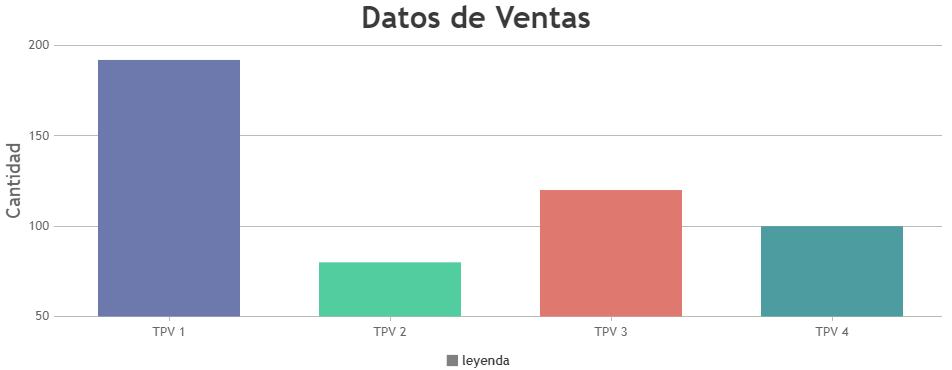
If this doesn’t solve your requirement, kindly share a sample project along with sample data over google-drive or onedrive so that we can understand your requirement better and help you out.
__
Priyanka M S
Team CanvasJSYou can get the interval data from the database and assign it to a variable in the back-end(C#), then you can use the same variable in the front-end(HTML) with the help of inline expressions.
ex:var updateInterval = <%= variable_name %>;
Assigning this inline expression to updateInterval should work fine in your case.__
Priyanka M S
Team CanvasJSIn order to render chart on the server side you would require a headless browser like PhantomJS. Here is an article which might help.
Please take a look at this sample PhantomJS project, that captures the chart image from web page and saves it to a particular location. Please refer to instructions.txt file for clear understanding.
__
Priyanka M S
Team CanvasJSayesha singh,
This error is due to improper servlet configuration. Please take a look at this article which could be of help.
__
Priyanka M S
Team CanvasJSayesha singh,
These errors are due to improper project configuration. Please refer to these links which would help you to solve initial set up issues.
1.CannotLoadBeanClassException
2.Injection of autowired dependencies failed__
Priyanka M S
Team CanvasJSayesha singh,
Please refer to our download page for downloading a sample project for integrating CanvasJS charts in Spring MVC application.
__
Priyanka M S
Team CanvasJSAs of now, in the given sample project, chart gets updated whenever a new dataPoint is added to the database. If you are updating the database at a certain interval, the chart gets updated accordingly.
If this doesn’t solve your requirement, please brief us further so that we can understand it better and help you out.
__
Priyanka M S
Team CanvasJSFor security reasons, browsers restrict cross-origin requests. JSONP allows you to sidestep the cross-origin requests. To access JSON from different domain, you can refer to JSONP. Please take a look at this jsfiddle that creates a line chart from AJAX & JSONP.
In order to load a local JSON file on browser, you need to have a local server running in your system to avoid cross origin requests which most of the browsers doesn’t support. Here is a tutorial on setting up a local server, which might be of help.
Please take a look at this jsfiddle that creates a line chart from external JSON data.__
Priyanka M S
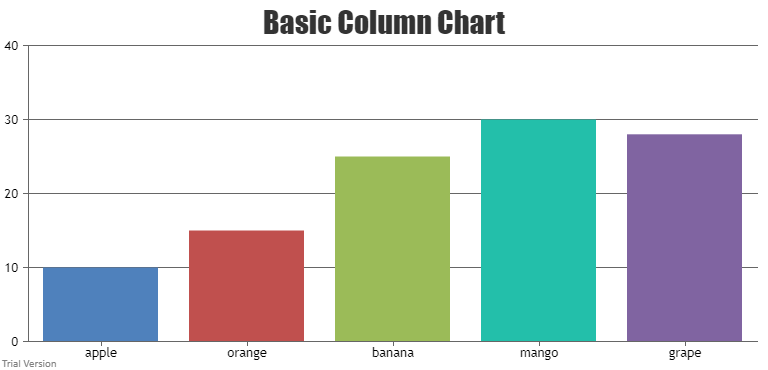
Team CanvasJSTrial Version is for evaluation purposes for up to 30 days. To use charts without ‘Trial Version’ and ‘CanvasJS’ Credit Link you will need to have a Commercial Version of CanvasJS. Please contact sales@canvasjs.com for sales related queries.
__
Priyanka M S
Team CanvasJSGlad that you figured it out. Also, below are the steps to import CanvasJS chart in an electron app.
1. Download the library from our download page and save it in your source folder.
2. To use CanvasJS Chart in your electron app, you need to import CanvasJS from canvasjs.min.js. Please find the below snippet for the same
var CanvasJS = require('./canvasjs.min')Here is a complete code example for integrating Chart with an electon app.
__
Priyanka M S
Team CanvasJSPlease take a look at this sample project, which updates the chart when dataPoints are added to the database. Also please refer the ReadMe.txt file present in the sample project for setup related information.
__
Priyanka M S
Team CanvasJSIn this scenario, you should have a local server to load local text files as browsers do not support local files due to cross origin requests. Here is a tutorial on setting up a local server, which might be of help.
__
Priyanka M S
Team CanvasJS