Login to Ask a Question or Reply
Forum Replies Created by Manoj Mohan
-
May 26, 2020 at 7:13 pm in reply to: Change the position of the rectangle that compose the StackedBar #29364
Please take a look at the documentation page for information on Stacked Bar Chart and mousemove event.
—
Manoj Mohan
Team CanvasJSResetting the maximum by setting it to null on adding new dataPoint should work fine in your case.
Please take a look at this gallery page which shows dynamic chart where maximum is auto-updated when a new dataPoint is added.
—-
Manoj Mohan
Team CanvasJSMay 20, 2020 at 7:18 pm in reply to: how to plot my graph using local storage and render chart to different html page #29318Please take a look at this documentation page for tutorial on creating chart using JSON data. Also, take a look at this JSFiddle for an example on creating chart using dataPoints from localStorage.
—-
Manoj Mohan
Team CanvasJSRon,
A logarithmic axis can only plot positive values. There simply is no way to put negative values or zero on a logarithmic axis.
Fundamental: If 10L = Z, then L is the logarithm (base 10) of Z. If L is a negative value, then Z is a positive fraction less than 1.0. If L is zero, then Z equals 1.0. If L is greater than 0, then Z is greater than 1.0. Note that there no value of L will result in a value of Z that is zero or negative. Logarithms are simply not defined for zero or negative numbers.
—-
Manoj Mohan
Team CanvasJSSorry, multi-series donut chart is not available as of now. However, you can draw one donut over another as shown in this JSFiddle.
—-
Manoj Mohan
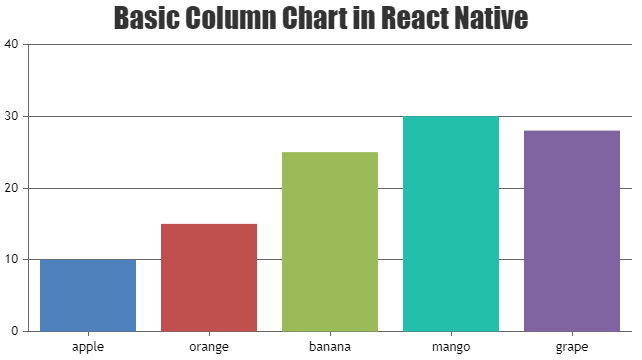
Team CanvasJSPlease take a look at this Sample Project on rendering chart in React Native app with the help of WebView.

—-
Manoj Mohan
Team CanvasJSPlease take a look at this JSFiddle for the nearest possible solution.
—-
Manoj Mohan
Team CanvasJSCan you kindly create JSFiddle reproducing the issue you are facing and share it with us so that we can look into your code, understand the scenario better and help you out?
—-
Manoj Mohan
Team CanvasJSCalling render method after mounting (testMounted value changes to true) should work fine in this case.
If you are still facing the issue, kindly create a sample project reproducing the issue and share it with us over Google-Drive or Onedrive along with the sample data so that we can look into the code, run it locally to understand the scenario better and help you resolve.
—-
Manoj Mohan
Team CanvasJSMay 6, 2020 at 7:16 pm in reply to: Crosshair Render Entering Infinite Loop in generateValueFormatString Function #29194It seems to be working fine. Can you kindly create a sample project reproducing the issue and share it over Google-Drive or OneDrive along with sample data so that we can look into your code, understand the scenario better and help you out?
From what we have observed, sometimes things get delayed mostly when we are not able to reproduce the issue or not able to understand the exact requirements or the solution that we provide may not work properly due to the variation in chart-options being used by you and us.
Having a sample project helps us in figuring out the issue and suggesting an appropriate solution accordingly.
—-
Manoj Mohan
Team CanvasJSSorry, exporting chart data as a CSV file is not available as an inbuilt feature as of now. However, you can try out some third party library to export JSON as CSV like sheetjs.
—-
Manoj Mohan
Team CanvasJSStefan,
You can try to set the minimum width for dataPoints to achieve your requirements as shown in this JSFiddle.
—-
Manoj Mohan
Team CanvasJSIndexLabels / labels in Pie Chart are skipped whenever they get closer to other indexLabels – this behavior is by design. You can try to show more labels by rotating the Pie Chart by setting startAngle.
—-
Manoj Mohan
Team CanvasJS