Login to Ask a Question or Reply
Forum Replies Created by Bivek Singh
-
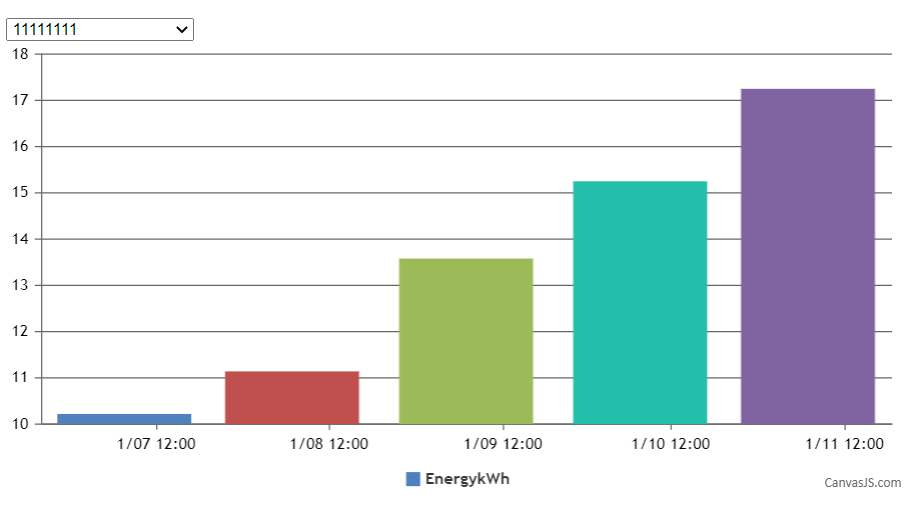
To render the chart each time with animation, you will need to create a new chart with updated options based on the value selected from dropdown. Code snippet below shows how you can achieve the same:
$( ".dropdown" ).change(function() {
  options.data[0].dataPoints = [];
  var e = document.getElementById("dropdownMenu");
  var selected = e.options[e.selectedIndex].value;
  dps = jsonData[selected];
  for(var i in dps) {
    var xVal = dps[i].x;
    options.data[0].dataPoints.push({x: new Date(xVal), y: dps[i].y});
  }
  (new CanvasJS.Chart("chartContainer", options)).render();
});
Please take a look at this JSFiddle for a working example with sample code.
—-
Bivek Singh-
This reply was modified 9 years, 4 months ago by
Bivek Singh.
Andrew,
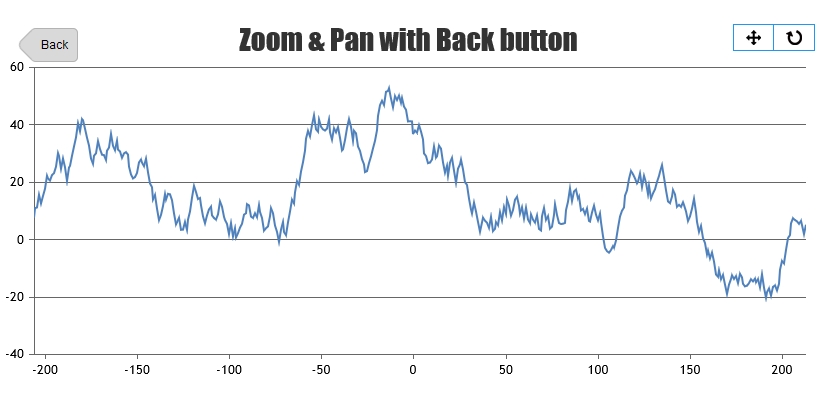
Thank you for choosing CanvasJS. As of now, Zoom Out in steps is not available out of the box. It is on our road map but we don’t have a timeline for it yet. Meanwhile, you can easily achieve by programmatically changing viewportMinimum and viewportMaximum upon clicking zoom-back button. Please find the code-snippet below.
function back() {
  var viewportMinStack = chart.options.viewportMinStack;
  var viewportMaxStack = chart.options.viewportMaxStack;

  if(viewportMinStack.length > 1) {
    viewportMinStack.pop();
    viewportMaxStack.pop();
    axisX[0].viewportMinimum = viewportMinStack[viewportMinStack.length-1];
    axisX[0].viewportMaximum = viewportMaxStack[viewportMaxStack.length-1];
  }  else {
    axisX[0].viewportMinimum = null;
    axisX[0].viewportMaximum = null;
    backButton.style.visibility = "hidden";
  }

  chart.render();
}

backButton.addEventListener("click", back);
Please take a look at this JSFiddle for complete code.
—-
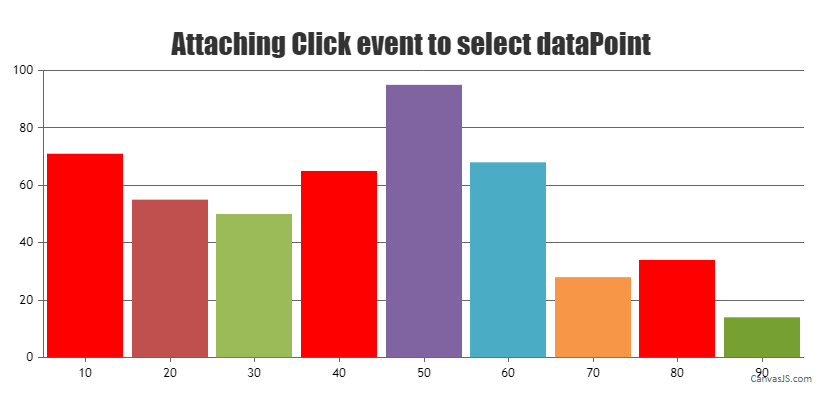
Bivek SinghTo highlight a dataPoint on mouse click, you can use the click property to set the click event handler which is triggered when user clicks on a dataPoint.
Upon event, you will get access to the selected dataPoint’s details. In the case of highlighting a dataPoint, you can use the event related data to change the selected dataPoint’s color property.Please take a look at the code snippet below,
function onClick(e){
	if(!e.dataPoint.color) {
  	e.dataPoint.color = "red";
  } else {
  	e.dataPoint.color = null;
  }
  chart.render();
}
Please take a look at this JSFiddle for an example with complete code for attaching click event to highlight datapoint.
—-
Bivek SinghMarch 8, 2017 at 6:31 pm in reply to: Bubble Chart bubble Overlapping causes wrong mouse over #14515Yael,
I’m sorry but as of now, this is not possible.
—-
Bivek SinghMarch 3, 2017 at 3:50 pm in reply to: How To Set The IntervalType and Interval Programmatically #14462You can change / set different properties of a chart using set method. In your case, using
chart.axisX[0].set("interval", 4);will work.—-
Bivek SinghReynaldo,
You can set the color of entire series by using color property in dataSeries. There is no option to turn off multi-color option other than that.
——
Bivek SinghMethods and properties were introduced in v1.9.6 so this can’t be done with older versions. Please download the latest version from here.
——
Bivek SinghThe selection area gets clear only when the mouse moves out of chart. When the mouse is still over the chart, it won’t clear the selected area. Can you kindly create a jsfiddle with the issue so that we can look into the issue and help you out?
——
Bivek SinghjQuery.isEmptyObject is used to check if the object is empty and doesn’t contain any properties. The JSON that you provided is actually an array of objects. So, you can check the length of an array to check if the JSON file that you obtained is empty or not.
Here is an updated jsFiddle for same.——
Bivek Singh -
This reply was modified 9 years, 4 months ago by