Login to Ask a Question or Reply
You must be logged in to post your query.
Home › Forums › Chart Support › Chart via JSON
Chart via JSON
- This topic has 1 reply, 2 voices, and was last updated 10 years, 12 months ago by
Anjali.
-
June 23, 2015 at 9:26 pm #9117
Hi all,
just started using CanvasJS to include graphics in a HTML page. The data for these charts is fetched via PHP from a SQL Database. This data is composed of 2 columns (i.e. species (source) and number of elements per species(sourcecount) ) and the objective is to do a graph x=species name / y= number of elements per species. The type of specie can change from time to time so I need to fetch the data from the DB every time the graph is made.
At this moment I got an JSON result for my query that looks like this:[{“source”:””,”sourcecount”:1},{“source”:”Aquifex aeolicus”,”sourcecount”:3},{“source”:”Aquifex aeolicus VF5″,”sourcecount”:3},{“source”:”Bos taurus”,”sourcecount”:3},{“source”:”Corynebacterium glutamicum”,”sourcecount”:2},{“source”:”Escherichia coli”,”sourcecount”:8},{“source”:”Escherichia coli BL21(DE3)”,”sourcecount”:3},{“source”:”Escherichia coli DH1″,”sourcecount”:1},{“source”:”Escherichia coli K-12″,”sourcecount”:7},{“source”:”Escherichia coli O157:H7″,”sourcecount”:2},{“source”:”Homo sapiens”,”sourcecount”:1},{“source”:”Methanocaldococcus jannaschii”,”sourcecount”:1},{“source”:”Methanocaldococcus jannaschii DSM 2661″,”sourcecount”:1},{“source”:”Microbacterium liquefaciens”,”sourcecount”:2},{“source”:”Mus musculus”,”sourcecount”:1},{“source”:”Neisseria meningitidis”,”sourcecount”:1},{“source”:”Proteus mirabilis”,”sourcecount”:1},{“source”:”Pyrococcus horikoshii”,”sourcecount”:2},{“source”:”Pyrococcus horikoshii OT3″,”sourcecount”:2},{“source”:”Salmonella enterica subsp. enterica serovar Typhimurium”,”sourcecount”:1},{“source”:”Shewanella oneidensis MR-1″,”sourcecount”:1},{“source”:”Squalus acanthias”,”sourcecount”:1},{“source”:”Sus scrofa”,”sourcecount”:1},{“source”:”Thermotoga maritima”,”sourcecount”:1},{“source”:”Thermus thermophilus HB8″,”sourcecount”:2},{“source”:”Vibrio cholerae”,”sourcecount”:2},{“source”:”Vibrio parahaemolyticus”,”sourcecount”:2}]
My question at the moment is how to create one chart with source in the x (showing the names of the species) and the sourcecount in the y.
Best Regards
Afonso
June 29, 2015 at 7:46 pm #9129[Update]
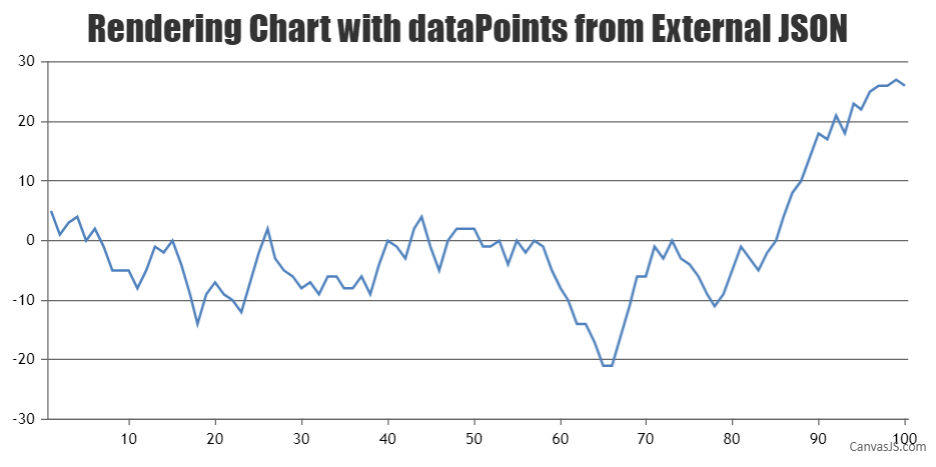
Now we have a Tutorial on Creating Charts from JSON Data in our documentation.
Hello,
You need to create a HTML page that does AJAX request and fetch the data. After getting the data, it will render a Chart. Please refer the below mentioned code :
<html>
<head>
    <script type="text/javascript" src="https://canvasjs.com/assets/script/jquery-1.11.1.min.js"></script>
    <script type="text/javascript" src="https://cdn.canvasjs.com/canvasjs.min.js"></script>
    <script type="text/javascript">
        $(document).ready(function () {

            var dataPoints = [];

            var chart = new CanvasJS.Chart("chartContainer",
            {
                    title: {
                        text: "Basic Column Chart"
                    },
                    data: [
                    {
                        dataPoints: []
                    }]
            });

            // Ajax request for getting JSON data
            //Replace data.php with your JSON API's url

            $.getJSON("data.php", function (data) {

                for (var i = 0; i < data.length; i++) {

                    dataPoints.push({ label: data[i].source, y: data[i].sourcecount });
                }

                chart.options.data[0].dataPoints = dataPoints;
                chart.render();
            });
        });
    </script>
</head>
<body>
    <div id="chartContainer" style="width: 50%; height: 300px;"></div>
</body>
</html>
You must be logged in to reply to this topic.