@oleglr,
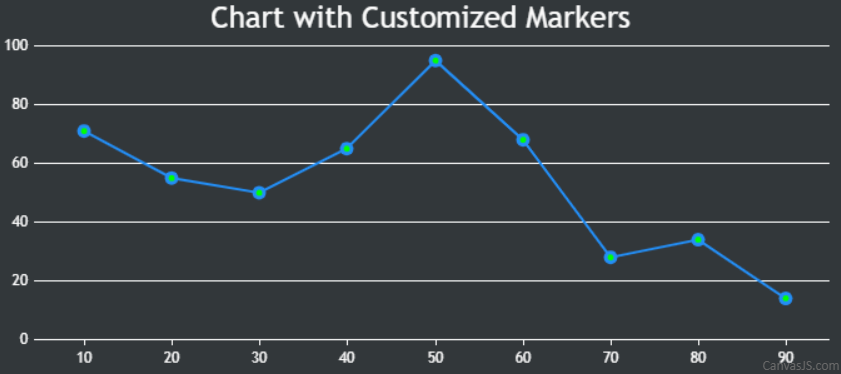
You can customize the line series to highlight the markers using the markerBorderColor, markerBorderThickness, markerColor, etc. properties as shown below –
data: [
  {
    markerBorderColor:"#238EF6",
    markerBorderThickness: 3,
    markerColor: "#00FF00",
    lineColor: "#238EF6",
    type: "line",
    dataPoints: [
      { x: 10, y: 71 },
      { x: 20, y: 55},
      { x: 30, y: 50 },
      { x: 40, y: 65 },
      { x: 50, y: 95 },
      { x: 60, y: 68 },
      { x: 70, y: 28 },
      { x: 80, y: 34 },
      { x: 90, y: 14}
    ]
  }
]
Please take a look at this JSFiddle for a working example. However, creating chart with ripple effect in the dataPoint is not possible as of now.

___________
Indranil Deo
Team CanvasJS

