Login to Ask a Question or Reply
You must be logged in to post your query.
Home › Forums › Chart Support › Apply dropdown filter in php with database search
Apply dropdown filter in php with database search
- This topic has 7 replies, 3 voices, and was last updated 5 years, 9 months ago by
Manoj Mohan.
Tagged: dropdown filter, mysql, php
-
May 15, 2019 at 2:18 pm #25187
Hi, I am looking for similar dropdown filter in php like this but with database search. I want to filter my charts using Year-wise that will display total number of appointments in each skill for that selected year.
Here is my php code where I tried to plot two graphs, one for all years and next for selection by year.
Much thanks for your help please.
<?php

$dataPoints = array();
$dataPoints2018 = array();
//Best practice is to create a separate file for handling connection to database
try{
     // Creating a new connection.
    // Replace your-hostname, your-db, your-username, your-password according to your database
    $link = new \PDO(   'mysql:host=localhost;dbname=project;charset=utf8mb4', //'mysql:host=localhost;dbname=canvasjs_db;charset=utf8mb4',
                        'root', //'root',
                        '', //'',
                        array(
                            \PDO::ATTR_ERRMODE => PDO::ERRMODE_EXCEPTION,
                            \PDO::ATTR_PERSISTENT => false
                        )
                    );
	// qurey for chart render for total appointments for all time topic-wise
    $handle = $link->prepare("SELECT COUNT(*) as count, a.id_skill, a.ap_meet_date, s.skill FROM appointment a,skills_data s WHERE a.id_skill=s.id_skill and a.ap_status = 'complete' GROUP BY <code>id_skill</code>");
    $handle->execute();
    $result = $handle->fetchAll(\PDO::FETCH_OBJ);

    foreach($result as $row){
        array_push($dataPoints, array("label"=> $row->skill, "y"=> $row->count));
    }
    $link = null;


    // OTHER USEFUL QUERIES

    // qurey for disticnt years in appointment table
    $year = ("SELECT DISTINCT YEAR(ap_meet_date) FROM appointment As YEAR");

    // qurey for chart render for total appointments topic-wise in each year
    $sesult_by_year = ("SELECT a.id_skill, YEAR(a.ap_meet_date) As YEAR, s.skill,COUNT(*) as count FROM appointment a,skills_data s WHERE a.id_skill=s.id_skill and a.ap_status = 'complete' GROUP BY <code>id_skill</code>, <code>YEAR</code> ORDER BY <code>YEAR</code>");

    // example query for 2017 and 2018 that can be used to print directly for 2017 and 2018
    $result_2017 = ("SELECT a.id_skill, YEAR(a.ap_meet_date) As YEAR, s.skill,COUNT(*) as count FROM appointment a,skills_data s WHERE a.id_skill=s.id_skill AND a.ap_status = 'complete' AND YEAR(a.ap_meet_date) = '2017' GROUP BY <code>id_skill</code>");
    $result_2018 = ("SELECT a.id_skill, YEAR(a.ap_meet_date) As YEAR, s.skill,COUNT(*) as count FROM appointment a,skills_data s WHERE a.id_skill=s.id_skill AND a.ap_status = 'complete' AND YEAR(a.ap_meet_date) = '2018' GROUP BY <code>id_skill</code>");

    foreach($result as $row){
        array_push($dataPoints2018, array("label"=> $row->skill, "y"=> $row->count));
    }
    $link = null;

}
catch(\PDOException $ex){
    print($ex->getMessage());
}

?>
<!DOCTYPE HTML>
<html>
<head>

<!-- Script to render pie chart for total count in all years   -->
<script>
window.onload = function () {

var chart = new CanvasJS.Chart("chartContainer", {
	animationEnabled: true,
	exportEnabled: true,
	theme: "light1", // "light1", "light2", "dark1", "dark2"
	title:{
		text: "Skills Distribution"
	},
	data: [{
		type: "pie", //change type to bar, line, area, pie, etc
		startAngle: 25,
		toolTipContent: "<b>{label}</b>: {y}",
// 		toolTipContent: "<b>{label}</b>: {y}%",
		showInLegend: "true",
		legendText: "{label}",
		indexLabelFontSize: 16,
		indexLabelPlacement: "inside",
		indexLabel: "{y}",
// 		indexLabel: "{label} - {y}",
// 		indexLabel: "{label} - {y}%",
		dataPoints: <?php echo json_encode($dataPoints, JSON_NUMERIC_CHECK); ?>
	}]
});
chart.render();

}
</script>

</head>
<body>

<!-- Renders pie chart for total count in all years   -->
<div id="chartContainer" style="height: 370px; width: 900px;"></div>

<!-- To render pie chart based on Dropdown filter using database   -->
<!-- Dropdown filter using database   -->
<br/>
<select class="dropdown" id="dd">
    <option value="" selected="selected">Select Year</option>
    <?php
    if (! empty($distinct_years)) {
        foreach ($distinct_years as $key => $value) {
            echo '<option value="' . $distinct_years[$key]['YEAR'] . '">' . $distinct_years[$key]['YEAR'] . '</option>';
             }
         }
    ?>
</select>

<!-- To render pie chart based on Dropdown filter using database   -->
<script type="text/javascript">
var dataPoints = [];
var chart = new CanvasJS.Chart("chartContainer2018",
{
	animationEnabled: true,
	exportEnabled: true,
	theme: "light1", // "light1", "light2", "dark1", "dark2"
  },
	data: [{
    showInLegend: true,
    type: 'pie',
    startAngle: 25,
	toolTipContent: "<b>{label}</b>: {y}",
    showInLegend: true,
    legendText: "{label}",
    dataPoints2018: <?php echo json_encode($dataPoints2018, JSON_NUMERIC_CHECK); ?>
//     dataPoints: dataPoints
	}]
});

$( ".dropdown" ).change(function() {
	chart.options.data[0].dataPoints2018 = [];
  var e = document.getElementById("dd");
	var selected = e.options[e.selectedIndex].value;
	YEAR = jsonData[selected];
//   dps = jsonData[selected];
  for(var i in YEAR) {
  	var xVal = dps[i].x;
    chart.options.data[0].dataPoints2018.push({x: new Date(YEAR), y: YEAR[i].y});
  }
  chart.render();
});

</script>
<div id="chartContainer2018" style="height: 370px; width: 900px;"></div>

<script src="https://cdn.canvasjs.com/canvasjs.min.js"></script>
</body>
</html>
May 16, 2019 at 5:58 pm #25203For creating a chart based on dropdown filter in php using data from database, you need to first create a php service
getData.phpwhich will provide data for any given year from database. Please take a below code snippet forgetData.phpservice.header('Content-Type: application/json'); $link = new \PDO( 'mysql:host=localhost;dbname=canvasjs_db;charset=utf8mb4', //'mysql:host=localhost;dbname=canvasjs_db;charset=utf8mb4', 'root', //'root', '', //'', array( \PDO::ATTR_ERRMODE => PDO::ERRMODE_EXCEPTION, \PDO::ATTR_PERSISTENT => false ) ); $handle = $link->prepare("SELECT * FROM datapoints where YEAR(x) = :year order by x"); $handle->bindParam(":year",$_GET["year"], PDO::PARAM_INT); $handle->execute(); $result = $handle->fetchAll(\PDO::FETCH_OBJ); $data_points = array(); foreach($result as $row){ // x column is in timestamp, convert unixtimestamp(seconds) to javascript timestamp(milliseconds) by multipying the x value by 1000 Please refer https://stackoverflow.com/a/15593812 for more information array_push($data_points, array("x"=> strtotime($row->x)*1000, "y"=> $row->y)); } $link = null; echo json_encode($data_points, JSON_NUMERIC_CHECK);You can call
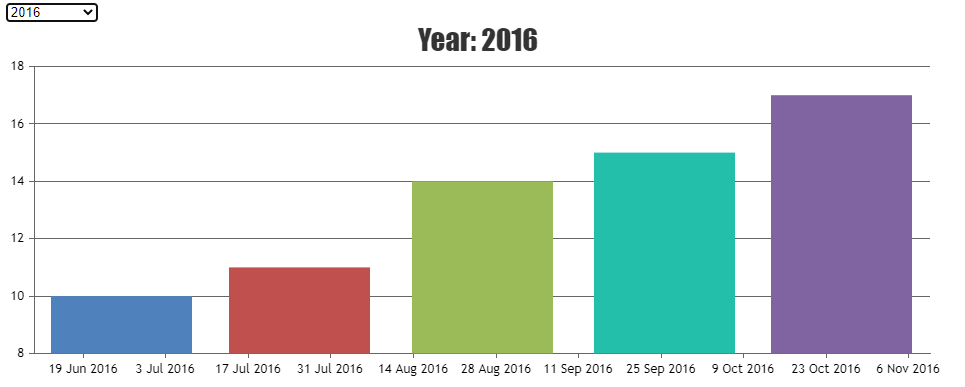
getData.phpservice upon changing the year through dropdown and render the chart with data received from the service. Please take a look the below code snippet for the same.$( ".dropdown" ).change(function() { chart.options.data[0].dataPoints = []; var e = document.getElementById("dd"); var selectedYear = e.options[e.selectedIndex].value; if( !isNaN(Number(selectedYear)) ) { chart.options.title.text = "Year: " + selectedYear; chart.options.title.verticalAlign = "top"; var data = { "year" : selectedYear } $.getJSON("getData.php", data, function(result){ chart.options.data[0].dataPoints = result; chart.render(); }) } else { chart.options.title.text = "Select Year From Dropdown"; chart.options.title.verticalAlign = "center"; } chart.render() });Also, Please take a look at this sample project for an example on creating chart based on dropdown filter in php using data from database.
——
Manoj Mohan
Team CanvasJSMay 17, 2019 at 12:29 pm #25215Thank you so much Manoj Mohan. It worked great with canvasjs_db for column chart :)
But when I tried to change to pie chart with my database data, the data displayed is correct but the legend value for each of my topic is displayed as “false”. Where do I need to change/modify in order to get the correct label?Much thanks for your help!
<script type="text/javascript"> $(document).ready(function () { var dataPoints = []; var chart = new CanvasJS.Chart("chartContainer", { title: { text: "Skills Distribution: Select Year From Dropdown", verticalAlign: "top" }, data: [{ type: "pie", //change type to bar, line, area, pie, etc startAngle: 25, toolTipContent: "<b>{label}</b>: {y}", showInLegend: "true", legendText: "{label}", indexLabelFontSize: 16, indexLabelPlacement: "inside", indexLabel: "{y}", dataPoints: dataPoints }] }); chart.render() $.getJSON("getYear.php", function(result){ $.each(result, function(i, field){ $(".dropdown").append("<option value='"+field+"'>"+field+"</option>"); }); }); $( ".dropdown" ).change(function() { chart.options.data[0].dataPoints = []; var e = document.getElementById("dd"); var selectedYear = e.options[e.selectedIndex].value; if( !isNaN(Number(selectedYear)) ) { chart.options.title.text = "Skills Distribution for Year: " + selectedYear; chart.options.title.verticalAlign = "top"; var data = { "year" : selectedYear } $.getJSON("getData.php", data, function(result){ chart.options.data[0].dataPoints = result; chart.render(); }) } else { chart.options.title.text = "Select Year From Dropdown"; chart.options.title.verticalAlign = "top"; } chart.render() }); }); </script>-
This reply was modified 7 years, 2 months ago by
Ganesh.
May 17, 2019 at 5:16 pm #25222You seem to be passing label for legendText which is not present in dataPoints. Either passing label or name or legendText in dataPoint should work fine in your case.
——
Manoj Mohan
Team CanvasJSMay 17, 2019 at 9:41 pm #25225Thanks so much! It worked now because I forgot to remove the strtotime() conversion code in getData.php file which I don’t need in my case
array_push($data_points, array("label"=> strtotime($row->skill), "y"=> $row->count)); //mistake
array_push($data_points, array("label"=> ($row->skill), "y"=> $row->count)); // corrected
February 17, 2020 at 7:58 pm #28409Hey i’ve try to change it to pie chart but i failed, could you give me the code please mr. Ganesh…?
October 5, 2020 at 10:58 am #31474hi everyone,
i have tried to put default year in the dropdwon but couldnot able to do show using chagne function. here is my code:
$( “.dropdown” ).change(function() {
chart.options.data[0].dataPoints = [];
var e = document.getElementById(“dd”);
var selectedYear = e.options[e.selectedIndex].value;
if( !isNaN(Number(selectedYear)) ) {
chart.options.title.text = “Year: ” + selectedYear;
chart.options.title.verticalAlign = “top”;
var data = { “year” : selectedYear }
$.getJSON(“getData.php”, data, function(result){
chart.options.data[0].dataPoints2019 = result;
chart.render();
})
} else {chart.options.title.text = “Select Year From Dropdown”;
chart.options.title.verticalAlign = “center”;}
chart.render()});
October 6, 2020 at 6:51 pm #31496Can you kindly create a sample project reproducing the issue you are facing and share it with us over Google-Drive or Onedrive along with sample data so that we can look into your code, run it locally at our end to understand the scenario better and help you out?
From what we have observed, sometimes things get delayed mostly when we are not able to reproduce the issue at our end or not able to understand the exact requirements or due to the variation in chart-options being used by you and us. Because of these reasons we expect you so share sample project along with sample data(dummy data) which helps us run it locally at our end to understand the use case and help you resolve.
—-
Manoj Mohan
Team CanvasJS -
This reply was modified 7 years, 2 months ago by
Tagged: dropdown filter, mysql, php
You must be logged in to reply to this topic.