Login to Ask a Question or Reply
Home › Forums › Chart Support › Сustom design of the chart elements › Reply To: Сustom design of the chart elements
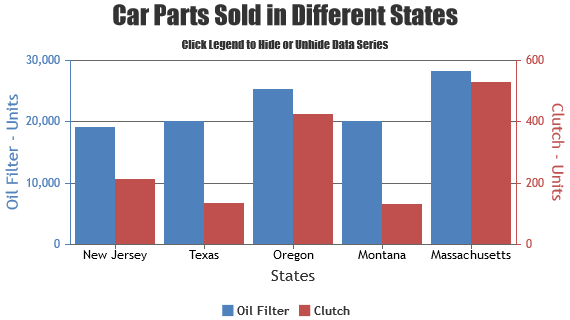
You can customize chart elements like Title, Legend, Axis, Data using chart options like fontFamily, fontColor, labelFontColor, labelFontFamily, labelFontSize, lineColor, makerColor, etc. Please refer to this documentation page for list of customization options available.
In particular, for example, to make the effect of waterlighting the lines of the chart, add the effect of ripple of chart points and chart elements. Could it be possible to use existing libraries with canvasjs connectivity?
Could you please provide a pictorial representation of your requirement so that we can understand your scenario better and help you out with appropriate resources?
___________
Indranil Deo
Team CanvasJS