Python Range Charts using Django
Python Range Charts are drawn between a range of values (High & Low) & are used to visualize high & low values simultaneously over a period of time. They are also referred to as Floating Charts as the range plotted is floating in given range instead of being attached to the base.
Library lets you add different types of range charts like Range Column, Range Bar, Range Area & Range Spline Area Charts to your Django application.
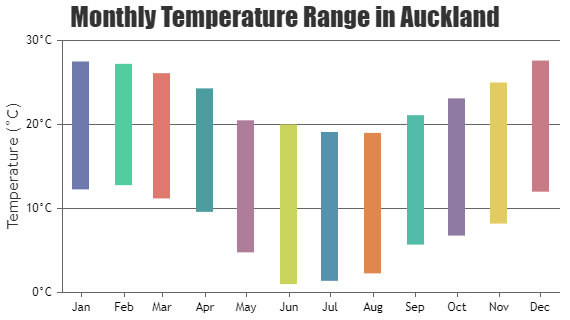
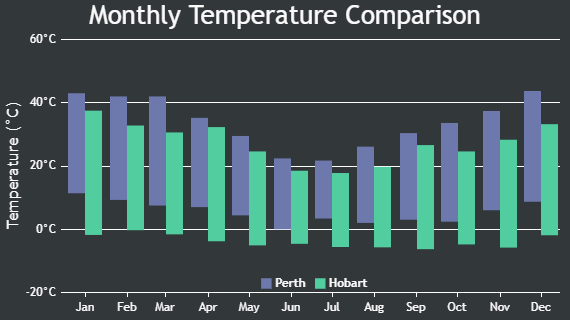
Python Range Column Charts
Range Column Charts are also referred to as Floating Column Chart as the columns are floating in given range.
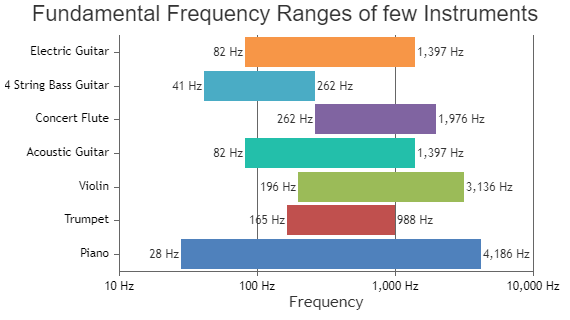
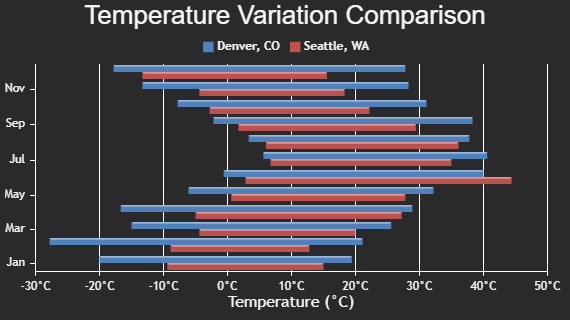
Python Range Bar Charts
Range Bar Charts are similar to range column except that these are horizontally placed.
Python Range Area Charts
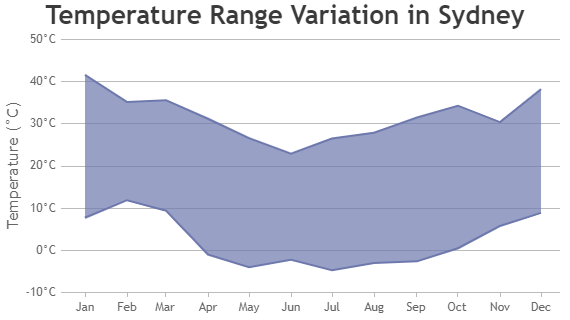
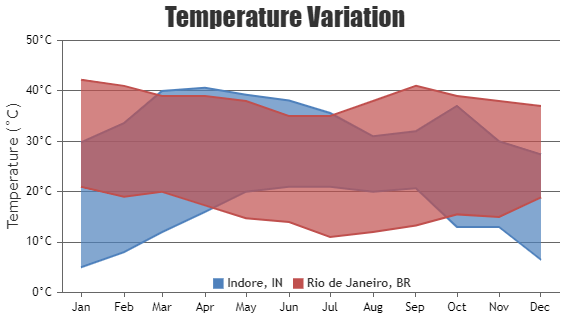
Range Area Chart is same as Area Chart except that it’s area is plotted between a given range.
Python Range Spline Area Charts
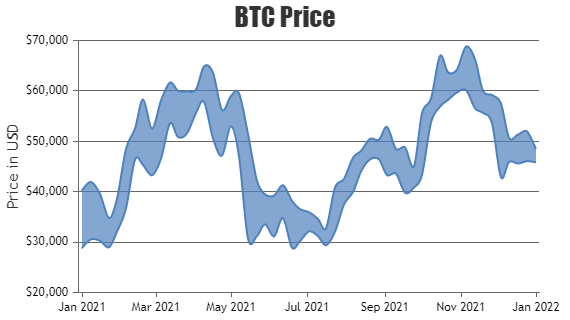
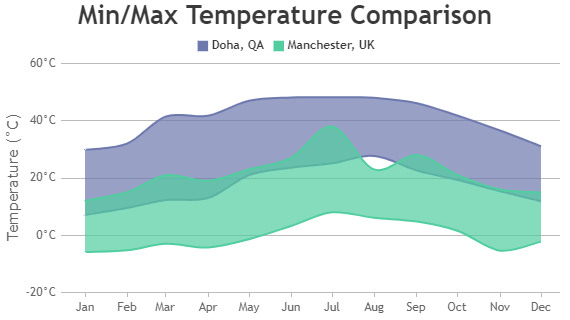
Range Spline Area is same as Range Area Chart except that the enclosing lines are smoother.
Features used in Python Range Charts
Most commonly used features in Python Range Chart includes animation, custom colorset, dataseries color, indexlabels, etc.
- You can animate the chart on initial render by setting animationEnabled property to true.
- Custom set of colors can be added to the chart by setting colorSet property.
- Color of the dataseries can be changed by setting color property.
- Indexlabel can be shown for a any datapoint by setting indexLabel property of datapoint.
Python Range Chart Types
General Tips for Python Range Charts
- Try not to use includeZero property in Range Charts as the focus is on the range & setting includeZero can defeat the purpose.
- It is recommended to sort datapoints in ascending order of x values.
- Use multiple axes when two dataseries have different units / scale ranges.
