Python Funnel & Pyramid Charts using Django
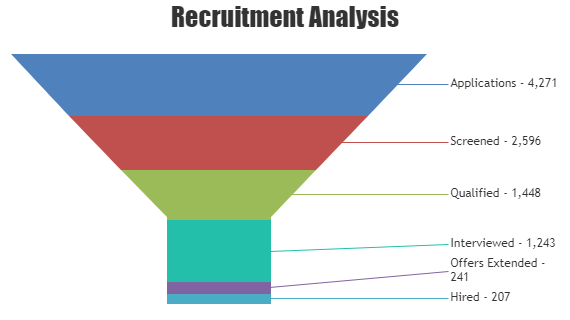
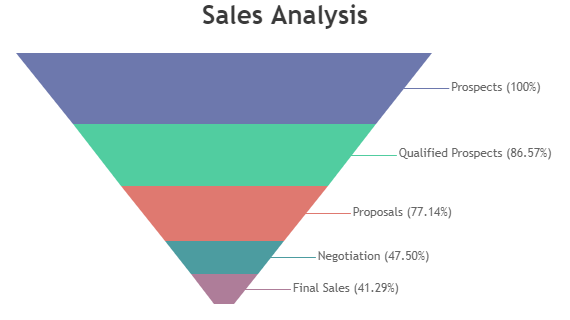
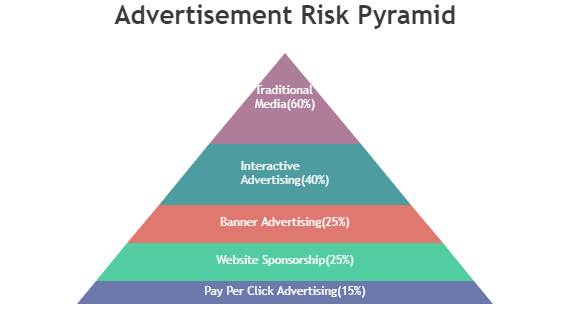
Python Funnel & Pyramid Charts illustrate stages within a process that are linear, connected & sequential. Funnel Charts are generally used to represent progressive decrease of data in a processes like in sales / marketing reports to analyze the decline in the number of participants in each stage. Pyramid Charts are similar to a reversed funnel chart without neck.
Python Funnel Charts
Funnel charts display progressive decrease of data in a process.
Python Pyramid Charts
Pyramids are similar to a reversed funnel chart with no neck, also referred to as triangular charts.
Features Commonly used in Python Funnel & Pyramid Charts
Most commonly used features in Python Funnel & Pyramid Charts include value-represents, customizing width & height of neck, etc.
- valueRepresents property lets you specify whether values in Funnel / Pyramid Charts are proportional to respective section’s height or area.
- Neck width & height can be controlled by setting neckWidth & neckHeight properties.
- explodeOnClick property lets you decide whether the section should explode on clicking it or not.
Python Funnel & Pyramid Chart Types
General Tips for Python Funnel & Pyramid Charts
- Try to include atleast 3 stages in a Funnel / Pyramid Charts. When there are only two stages in a process, we only have a single ratio to comprehend. It’s better to use pie chart in such scenarios.


