Python Financial & Advanced Charts
Python Financial Charts are type of charts that are used to analyze various business & financial metrics like budgets, expenses, cash-flow, liquidity, etc. CanvasJS lets you add financial charts like Candlestick & OHLC to your Django app. Line & column charts can be used to show technical indicators.
Library also supports advanced chart types like Box & Whisker Chart, Waterfall chart.
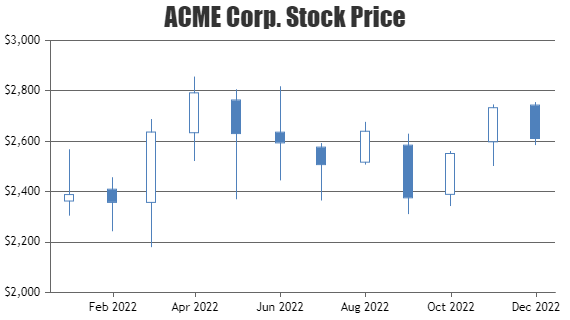
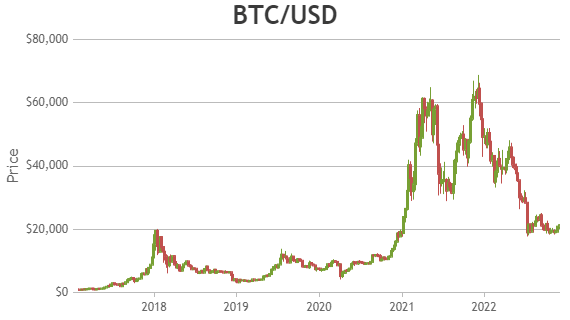
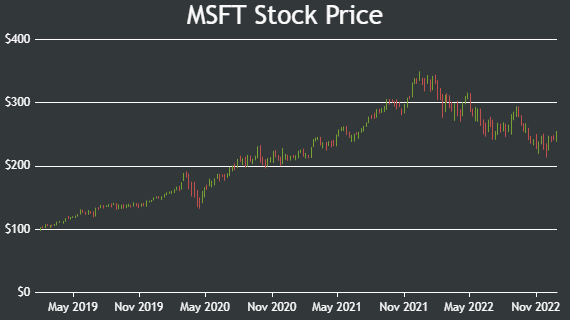
Python Candlestick Charts
Candlestick Chart shows open, high, low & close values with column & vertical lines.
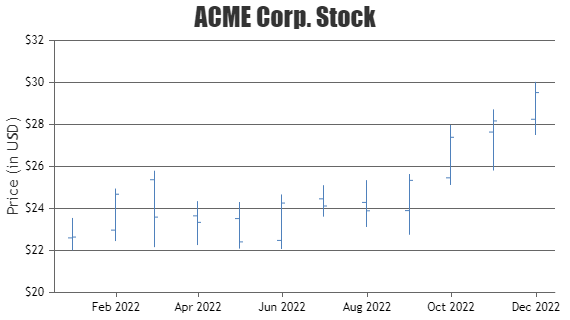
Python OHLC Charts
OHLC Chart uses vertical & horizontal lines to show open, high, low, closing price of the stock.
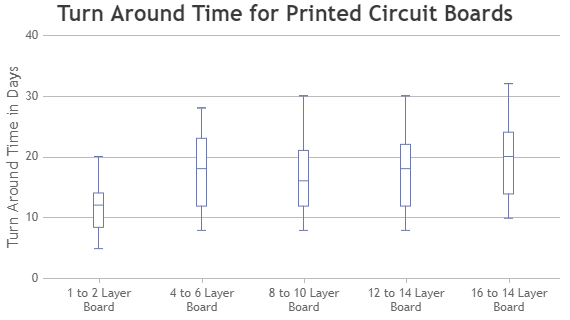
Python Box & Whisker Charts
Box & Whisker uses box & lines representing minimum, maximum, quartiles & median / mean values of a datapoint.
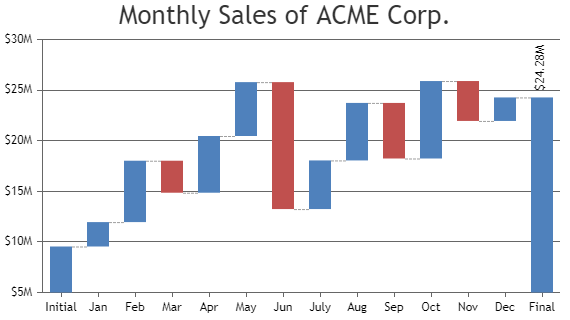
Python Waterfall Charts
Waterfall Chart helps in understanding cumulative effect of positive or negative values in finance.
Features used Commonly in Python Financial & Advanced Charts
Most commonly used features in Python Financial & Advanced Charts include rising & falling colors, upper & lower box colors, etc.
- You can change risingColor & fallingColor to show uptrend & downtrend in the chart.
- Color of upper & lower box can be changed using upperBoxColor & lowerBoxColor properties.
Python Financial & Advanced Chart Types
General Tips for Python Financial & Advanced Charts
- Use Line Chart & Column Chart to show technical indicators.
- Show uptrend & downtrend by changing color, risingColor & fallingColor.
