Python Combination Charts in Django
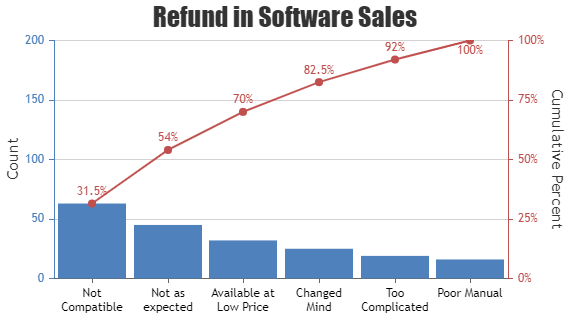
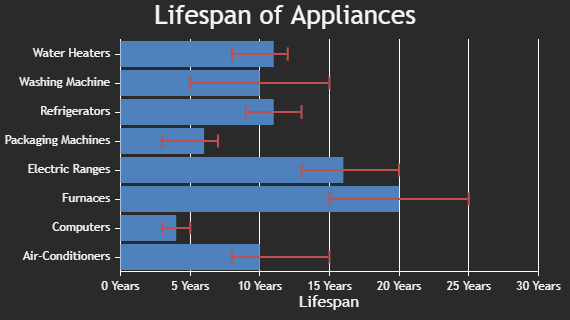
Python Combination Chart lets you display different chart types in a single chart. Library supports combining line, column, area, range, financial charts, etc. & render them in a single chart. They are also referred to as Combo / Mixed Charts.
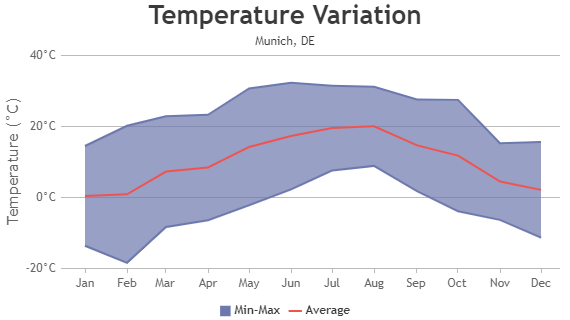
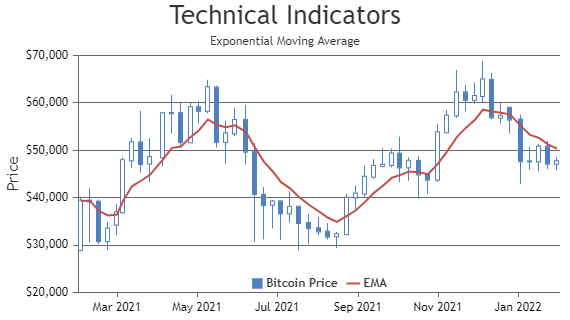
Combination of Python Range & Line Charts are typically used to show range (high & low values) along with their average simultaneously. Similarly, in case of financial charts like Candlestick & OHLC, Line & Column Charts are used in showing technical indicators.
Python Combination Charts
Combination Charts are formed by combining multiple chart types in a single chart.
Features Commonly used in Python Combination Charts
Most commonly used features in Python Combination Charts include showing legends, hiding / unhiding dataseries on legend click, colors, etc.
- You can show dataseries name in legend using showInLegend property.
- You can hide / unhide dataseries on clicking the legend items by toggling visible property of dataseries.
- Color of dataseries can be changed by setting color property.
General Tips for Python Combination Charts
- While combining area chart with any other chart type, always render area chart first & then the other types. Otherwise area chart will end up hiding other charts.
- While combining multiple chart types, consider using opacity to improve visibility.
- In case of financial charts, most of the technical indicators can be added to chart using line chart.


