Python Column Charts using Django Framework
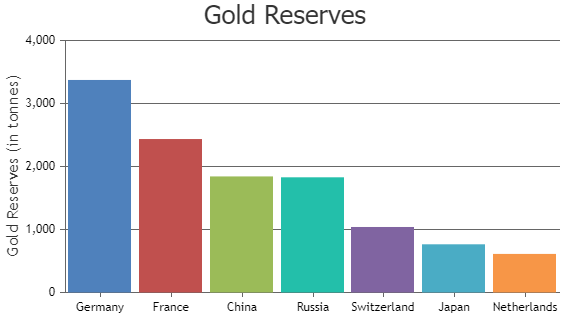
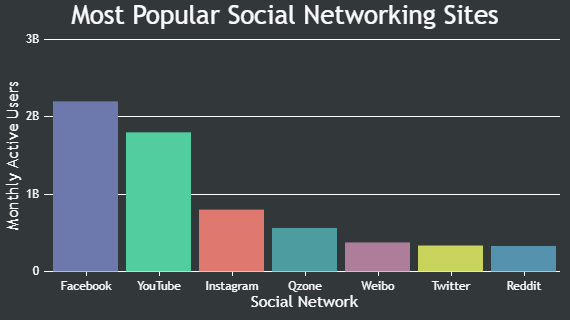
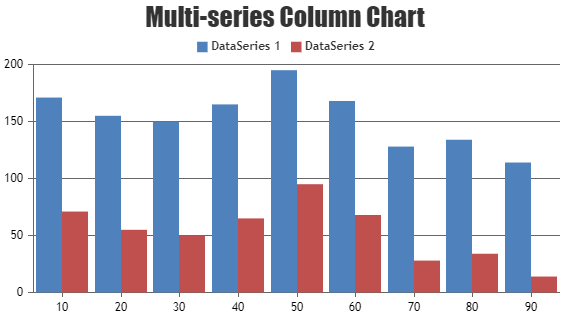
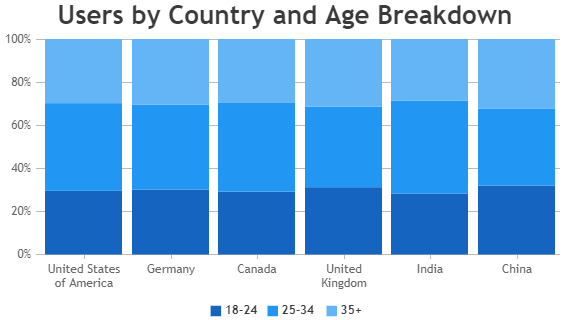
Python Column Charts represent data in the form of rectangular bars with height proportional to y-value. Bars are plotted vertically & sometimes referred to as vertical bar charts. Library comes bundled with different variants of Column Charts like Column, Multi-Series Column, Stacked Column & Stacked Column 100% Charts.
Python Column Charts
Column Charts are useful in comparing values between datapoints of different categories or values.
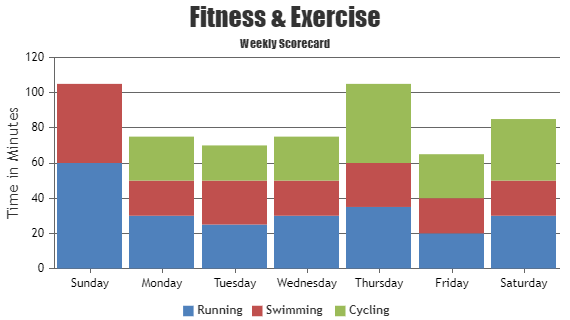
Python Stacked Column Charts
Stacked Column Chart comprises of multiple column series stacked one on top of another.
Features Commonly used in Python Column Charts
Most commonly used features in Python Column Chart includes animation, beveling the column, datapoint max-width, color, etc.
- Animation can be enabled by setting animationEnabled property to true.
- You can customize datapoint/dataseries colors as per your application theme by adding custom colorSet.
- Beveling / Chisel effect can be applied on each column by setting bevelEnabled property to true.
- Datapoint max-width can be set using dataPointMaxWidth property.
- Color of the column can be set by using color property.
Python Column Chart Types
General Tips for Python Column Charts
- Use multiple axes when two dataseries have different units / scale ranges.
- When you have more than 4 series, allow users to hide/unhide any series by clicking the legend.
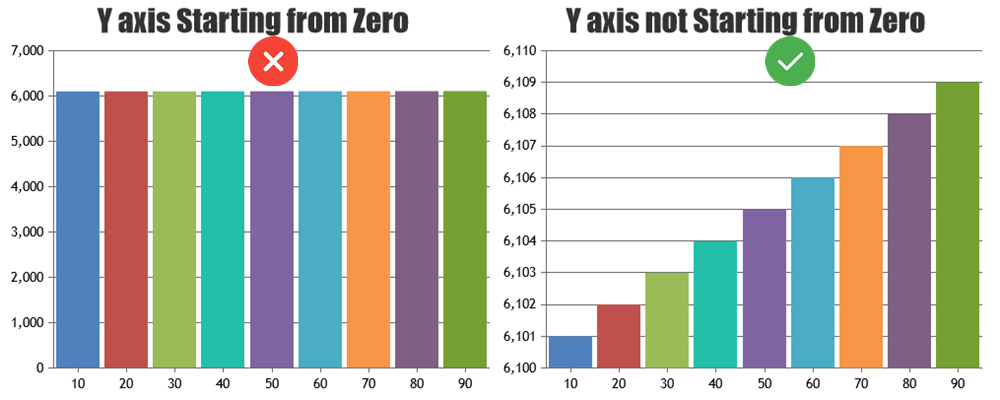
- Show zero baseline in vertical axis if and only if it’s required. Column charts should ideally show changes / variations in value clearly. Including zero in y-axis might not make the variations obvious when the variation in y values are small compared to their value.
