• Demos
    • JavaScript Charts
    • JavaScript StockCharts
  • Download/NPM
    • Download CanvasJS
    • Install via NPM
  • Integrations
    Front End Technology Samples
    • React Charts
    • Angular Charts
    • Vue.js Charts New!
    • jQuery Charts
    • Dashboards
    Server Side Technology Samples
    • PHP Charts
    • Python Charts New!
    • ASP.NET MVC Charts
    • Spring MVC Charts
    • JSP Charts
  • License
  • Blog
  • Docs
    • Chart Documentation
    • StockChart Documentation
  • Support Forum
    • Chart Support
    • StockChart Support
  • My Account
My Account
  • KEY FEATURES
    • Basic Chart
    • Chart with Animation
    • Chart with Zooming/Panning
    • Multi Series Chart
    • Chart with Multiple Axes
    • Chart with Logarithmic Axis
    • Chart with JSON Data
    • Dynamic Chart
    • Drilldown Chart
    • Responsive Chart
    • Synchronized Charts
  • LINE CHARTS
    • Line Chart
    • Dashed Line Chart
    • Multi Series Line Chart
    • Spline Chart
    • Multi Series Spline Chart
    • Step Line Chart
    • Multi Series Step Line Chart
  • BAR CHARTS
    • Bar Chart with Category Axis
    • Multi Series Bar Chart
    • Stacked Bar Chart
    • Stacked Bar 100% Chart
  • COLUMN CHARTS
    • Column Chart with Category Axis
    • Column Chart in Dark Theme
    • Multi Series Column Chart
    • Stacked Column Chart
    • Stacked Column 100% Chart
  • PIE & DOUGHNUT CHARTS
    • Pie Chart
    • Doughnut Chart
    • Doughnut Chart in Dark Theme
  • AREA CHARTS
    • Area Chart with Markers
    • Multi Series Area Chart
    • Spline Area Chart
    • Multi Series Spline Area Chart
    • Step Area Chart
    • Stacked Area Chart
    • Stacked Area 100% Chart
  • RANGE CHARTS
    • Range Column Chart
    • Multi Series Range Column Chart
    • Range Bar Chart
    • Multi Series Range Bar Chart
    • Range Area Chart
    • Multi Series Range Area Chart
    • Range Spline Area Chart
    • Multi Series Range Spline Area Chart
  • BUBBLE & SCATTER CHARTS
    • Bubble Chart with 3-Dimensional Data
    • Bubble Chart in Dark Theme
    • Scatter Chart
    • Multi Series Scatter Chart
  • FUNNEL & PYRAMID CHARTS
    • Funnel Chart with Index Labels
    • Funnel Chart without Neck
    • Pyramid Chart
  • FINANCIAL CHARTS
    • Candlestick Chart
    • Candlestick Chart from JSON Data
    • OHLC Chart
    • OHLC Chart from JSON Data
    • Box & Whisker Chart
    • Waterfall Chart
  • COMBINATION CHARTS
    • Pareto Chart
    • Error Bar Chart
    • Combination of Range Area & Line Chart
    • Combination of Candlestick & Line chart
  • DYNAMIC CHARTS
    • Dynamic Line Chart
    • Dynamic Column Chart
  • DATA BINDING
    • Chart with Data from CSV
    • Chart with Data from Database
    • Chart with Date-Time Axis from Database
  • JAVASCRIPT, JQUERY, REACT, ANGULAR, VUE.JS
    • JavaScript Charts
    • jQuery Charts
    • React Charts
    • Angular Charts
    • Vue.js Charts
  • SERVER SIDE TECHNOLOGIES
    • ASP.NET MVC Charts
    • PHP Charts
    • Spring MVC Charts
    • JSP Charts

Python Charts with Data from Various Data-Sources

Download Python Django Chart Samples
  • Python Django Chart Samples
  • JavaScript Chart Samples
  • React Chart Samples
  • Angular Chart Samples
  • Vue.js Chart Samples
  • jQuery Chart Samples
  • PHP Chart Samples
  • ASP.NET Chart Samples
  • JSP Chart Samples
  • Spring MVC Chart Samples
  • Dashboard Samples
  • JavaScript StockChart Samples

Python Charts can be rendered with data from different sources including JSON, CSV, XML, Database, etc. In the below listed examples data is being populated from SQLite database or CSV source. All the chart demos include Django source code so that you can copy-paste it to run locally.

Python Charts from Different Data Sources

Charts can be rendered with data from various sources like JSON, CSV, Database, etc.

Python Line Chart with Data from CSV file source
Chart with Data from CSV
Python Chart with Data from Database
Chart with Data from Database
Python Chart with Date-Time Data from Database
Chart with Date-Time Axis from Database

General Tips for Python Charts with Database

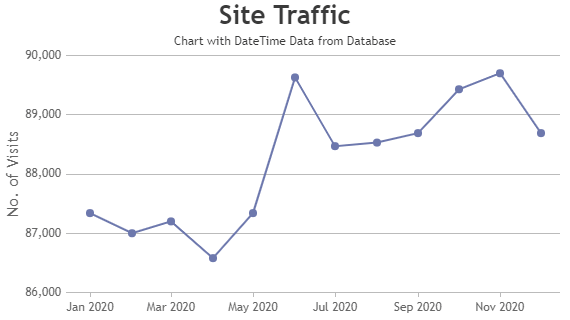
  • When you are passing date-time values fetched from database to the chart, first convert python date to timestamp by using datetime.timestamp method & then to JavaScript timestamp by multiplying it with 1000.

Quick Links

  • Chart Docs
  • StockChart Docs
  • About Us
  • FAQs

Server Side Technologies

  • ASP.NET MVC Charts
  • PHP Charts
  • JSP Charts
  • Spring MVC Charts

Front Side Technologies

  • JavaScript Charts
  • jQuery Charts
  • React Charts
  • Angular Charts
  • JavaScript StockCharts

Contact

  • Fenopix, Inc.
  • 2093 Philadelphia Pike,
  • #5678, Claymont,
  • Delaware 19703
  • United States Of America

©2025 Fenopix Privacy Policy Cookies Policy Careers