• Demos
    • JavaScript Charts
    • JavaScript StockCharts
  • Download/NPM
    • Download CanvasJS
    • Install via NPM
  • Integrations
    Front End Technology Samples
    • React Charts
    • Angular Charts
    • Vue.js Charts New!
    • jQuery Charts
    • Dashboards
    Server Side Technology Samples
    • PHP Charts
    • Python Charts New!
    • ASP.NET MVC Charts
    • Spring MVC Charts
    • JSP Charts
  • License
  • Blog
  • Docs
    • Chart Documentation
    • StockChart Documentation
  • Support Forum
    • Chart Support
    • StockChart Support
  • My Account
My Account
  • KEY FEATURES
    • Basic Chart
    • Chart with Animation
    • Chart with Zooming/Panning
    • Multi Series Chart
    • Chart with Multiple Axes
    • Chart with Logarithmic Axis
    • Chart with JSON Data
    • Dynamic Chart
    • Drilldown Chart
    • Responsive Chart
    • Synchronized Charts
  • LINE CHARTS
    • Line Chart
    • Dashed Line Chart
    • Multi Series Line Chart
    • Spline Chart
    • Multi Series Spline Chart
    • Step Line Chart
    • Multi Series Step Line Chart
  • BAR CHARTS
    • Bar Chart with Category Axis
    • Multi Series Bar Chart
    • Stacked Bar Chart
    • Stacked Bar 100% Chart
  • COLUMN CHARTS
    • Column Chart with Category Axis
    • Column Chart in Dark Theme
    • Multi Series Column Chart
    • Stacked Column Chart
    • Stacked Column 100% Chart
  • PIE & DOUGHNUT CHARTS
    • Pie Chart
    • Doughnut Chart
    • Doughnut Chart in Dark Theme
  • AREA CHARTS
    • Area Chart with Markers
    • Multi Series Area Chart
    • Spline Area Chart
    • Multi Series Spline Area Chart
    • Step Area Chart
    • Stacked Area Chart
    • Stacked Area 100% Chart
  • RANGE CHARTS
    • Range Column Chart
    • Multi Series Range Column Chart
    • Range Bar Chart
    • Multi Series Range Bar Chart
    • Range Area Chart
    • Multi Series Range Area Chart
    • Range Spline Area Chart
    • Multi Series Range Spline Area Chart
  • BUBBLE & SCATTER CHARTS
    • Bubble Chart with 3-Dimensional Data
    • Bubble Chart in Dark Theme
    • Scatter Chart
    • Multi Series Scatter Chart
  • FUNNEL & PYRAMID CHARTS
    • Funnel Chart with Index Labels
    • Funnel Chart without Neck
    • Pyramid Chart
  • FINANCIAL CHARTS
    • Candlestick Chart
    • Candlestick Chart from JSON Data
    • OHLC Chart
    • OHLC Chart from JSON Data
    • Box & Whisker Chart
    • Waterfall Chart
  • COMBINATION CHARTS
    • Pareto Chart
    • Error Bar Chart
    • Combination of Range Area & Line Chart
    • Combination of Candlestick & Line chart
  • DYNAMIC CHARTS
    • Dynamic Line Chart
    • Dynamic Column Chart
  • DATA BINDING
    • Chart with Data from CSV
    • Chart with Data from Database
    • Chart with Date-Time Axis from Database
  • JAVASCRIPT, JQUERY, REACT, ANGULAR, VUE.JS
    • JavaScript Charts
    • jQuery Charts
    • React Charts
    • Angular Charts
    • Vue.js Charts
  • SERVER SIDE TECHNOLOGIES
    • ASP.NET MVC Charts
    • PHP Charts
    • Spring MVC Charts
    • JSP Charts

Python Area Charts & Graphs

Download Python Django Chart Samples
  • Python Django Chart Samples
  • JavaScript Chart Samples
  • React Chart Samples
  • Angular Chart Samples
  • Vue.js Chart Samples
  • jQuery Chart Samples
  • PHP Chart Samples
  • ASP.NET Chart Samples
  • JSP Chart Samples
  • Spring MVC Chart Samples
  • Dashboard Samples
  • JavaScript StockChart Samples

Python Area Charts are similar on Line Charts with the region between line & the axis base filled with color. Area Charts are generally used to show trend, cumulative sum using numbers or percentages over a period of time. CanvasJS lets you add different variants of Area Charts to your Django app like Area, Multi Series Area, Spline Area, Step Area, Stacked Area & Stacked Area 100% Charts.

To make visualization better, markers are shown for every datapoint only when there are less number of datapoints. Markers get hidden when the data set is large. Library provides option to show markers at specific datapoint, letting you highlight particular datapoint out of a large dataset.
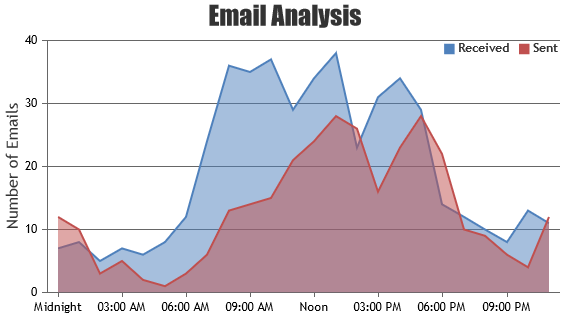
Python Area Charts

Area Charts are useful when you are interested in cumulative totals over a period of time.

Python Area Chart with Markers
Area Chart with Markers
Python Multi Series Area Chart using Django
Multi Series Area Chart

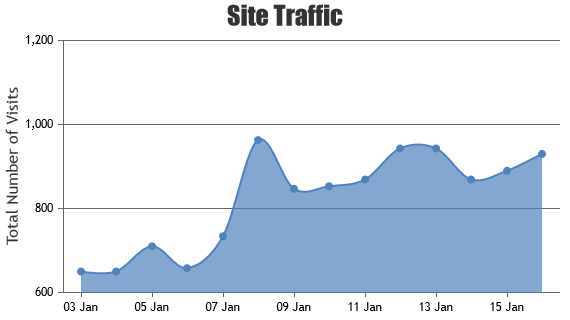
Python Spline Area Charts

Spline Area Chart is similar to area chart except that the envelope of area is a smooth curve.

Python Spline Area Chart using Django
Spline Area Chart
Python Multi Series Spline Area Chart using Django
Multi Series Spline Area Chart

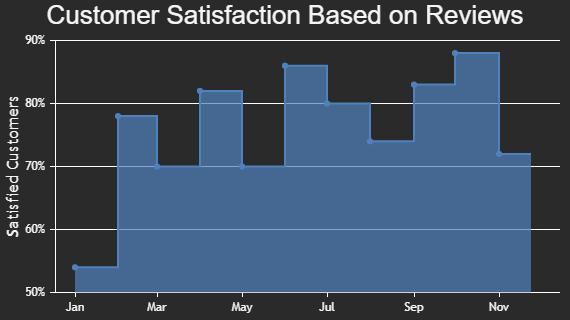
Python Step Area Charts

Step Area charts are drawn by connecting the data points using vertical and horizontal lines and shading the enclosed area.

Python Step Area Chart using Django
Step Area Chart

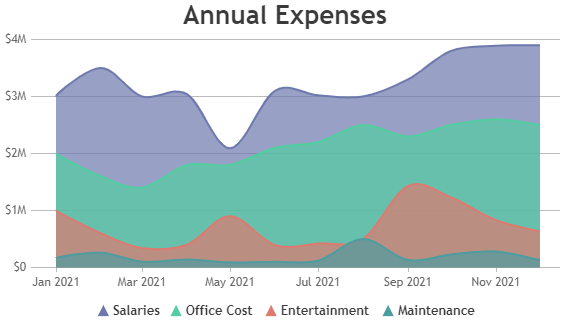
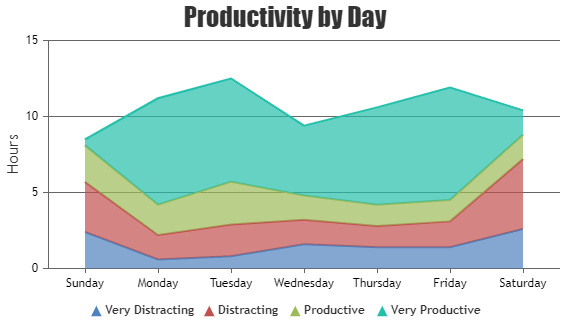
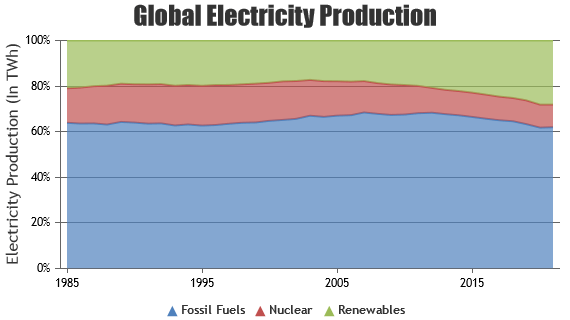
Python Stacked Area Charts

Stacked Area is formed by stacking multiple data-series of area type one on top of the other.

Python Stacked Area Chart using Django
Stacked Area Chart
Python Stacked Area 100% Chart using Django
Stacked Area 100% Chart

Features Commonly used in Python Area Charts

Most commonly used features in Python Area Chart includes markers, indexlabels, changing color & opacity of the filled region, etc.

  • You can control the envelope’s thickness by setting lineThickness property.
  • Size & type of the marker can be set using markerSize & markerType properties.
  • Indexlabel can be shown at a particular datapoint by setting indexLabel property in datapoint.
  • Color & opacity of the filled region can be changed by setting color & fillOpacity properties.
  • You can localize/customize culture specific elements of a chart using decimalSeparator & digitGroupSeparator in culture property of chart.

Python Area Chart Types

  • Python Area Chart
  • Python Spline Area Chart
  • Python Step Area Chart
  • Python Stacked Area Chart
  • Python Stacked Area 100% Chart

General Tips for Python Area Charts

  • Use Stacked Area Chart when you have multiple data sets and want to emphasize part-to-whole relationships.
  • Limit the number of area data series as they tend to overlap each other. You can also use transparency in such cases.
  • While combining area with other chart types, keep other types in front of area so that they are not hidden.

Quick Links

  • Chart Docs
  • StockChart Docs
  • About Us
  • FAQs

Server Side Technologies

  • ASP.NET MVC Charts
  • PHP Charts
  • JSP Charts
  • Spring MVC Charts

Front Side Technologies

  • JavaScript Charts
  • jQuery Charts
  • React Charts
  • Angular Charts
  • JavaScript StockCharts

Contact

  • Fenopix, Inc.
  • 2093 Philadelphia Pike,
  • #5678, Claymont,
  • Delaware 19703
  • United States Of America

©2025 Fenopix Privacy Policy Cookies Policy Careers