Login to Ask a Question or Reply
Forum Replies Created by Vishwas R
-
It seems your chart render the data two sides the upside render for the positive value and the downside render for the negative value.
Theoretically, negative values should be rendered below 0 and positive above 0. To make it look like even the negative values are positive, the work-around you are using seems to be a better option.
when I have hidden the income bar then the chart looks ugly.
To retain the range of the axis even after hiding the dataSeries, you can set axis minimum and maximum as shown in this updated JSFiddle.
—
Vishwas R
Team CanvasJSThanks for the follow up. We have already prioritized this bug and we are working on it. We will get back to you in couple of days on the fix for the same.
—
Vishwas R
Team CanvasJSYou can use Stacked Column Chart to achieve this. Please take a look at this JSFiddle.
—
Vishwas R
Team CanvasJSAs mentioned earlier it’s not possible to have minimum height of the column / bar as of now. However by setting axis range to a smaller value by keeping difference between viewportMinimum and viewportMaximum smaller along with adding scale-breaks, dataPoints can be made visible which helps you visualize better.
—
Vishwas R
Team CanvasJSIt’s not possible to set minimum-height of the column / bar, as of now. We will consider this behavior for future versions. However combination of Scalebreaks and Zooming / Panning would help you in this scenario. Please take a look at this updated JSFiddle.

—
Vishwas R
Team CanvasJSYou can change font-family of title, axis-title, axis-labels by setting fontFamily, titleFontFamily and labelFontFamily respectively. Please take a look at this JSFiddle, where Google Font is used for title.
—
Vishwas R
Team CanvasJSUpdating the index of dataSeries in intervalTypeChanger should work fine in your case. You are updating the dataPoints of first series in intervalTypeChanger instead of fourth series. Please take a look at this updated JSFiddle.
—
Vishwas R
Team CanvasJSdataSeries are attached to either primary Y-axis (axisY) or secondary Y-axis (axisY2) by setting axisYType to “primary” or “secondary” respectively. Setting axisYType to “secondary” in scatter series should render scatter series across axisY2, irrespective of static or dynamic dataPoints. Please find the updated code below:
data: [{
	lineThickness: 2,
	type: "scatter",
	name: "depth",
	axisYIndex: 0,
	axisYType: "secondary",
	dataPoints: gdepth[id],
	markerSize: 4,
}, {
	markerSize: 0,
	lineThickness: 2,
	name: "price",
	type: "line",
	color: "black",
	axisYIndex: 2,
	dataPoints: gprice[id],
}, {
	fillOpacity: 0.1,
	markerSize: 0,
	lineThickness: 1,
	axisYType: "secondary",
	name: "volume",
	type: "column",
	color: "black",
	dataPoints: gvolume[id],
}]
If you are still facing any issue, kindly create JSFiddle reproducing the issue you are facing so that we can look in to it and help you out.
—
Vishwas R
Team CanvasJSdataSeries are attached to either primary Y-axis (axisY) or secondary Y-axis (axisY2) by setting axisYType to “primary” or “secondary” respectively. Setting axisYType to “primary” and “secondary” in corresponding dataSeries should work fine in your case. Please find the updated code below:
axisX: {
	gridColor: "white",
	labelFontSize: 5,
	margin: 0,
	titleFontSize: 0,
	gridThickness: 0,
	tickLength: 0,
	lineThickness: 0,
	labelFormatter: function() {
		return " ";
	}
},
axisY: [{
	lineThickness: 0,
	tickLength: 0,

	labelFontSize: 12,
	labelFontColor: "#ccc",
	margin: 0,
	titleFontSize: 0,
	title: "Volume",
	gridColor: "white",
	includeZero: false,
}, {
	lineThickness: 0,
	tickLength: 0,
	title: "ginterest",
	labelFontSize: 12,
	labelFontColor: "#ccc",
	margin: 0,
	titleFontSize: 0,
	title: "oi",
	gridColor: "white",
	includeZero: false,
}

],
axisY2: [{
	lineThickness: 0,
	tickLength: 0,
	labelFontSize: 12,
	margin: 0,
	titleFontSize: 0,
	title: "price",
	gridColor: "white",
	includeZero: true,
}
],
data: [{
	lineThickness: 2,
	type: "scatter",
	name: "depth",
	axisYIndex: 0,
	axisYType: "secondary", //secondary y-axis will be shown towards left
	dataPoints: gdepth[id],
	markerSize: 4,
}, {
	markerSize: 0,
	lineThickness: 2,
	name: "price",
	type: "line",
	color: "black",
	axisYIndex: 2,
	dataPoints: gprice[id],
}, {
	fillOpacity: 0.1,
	markerSize: 0,
	lineThickness: 1,
	axisYType: "primary", //primary y-axis will be shown towards left
	name: "volume",
	type: "column",
	color: "black",
	dataPoints: gvolume[id],
}]
If you are still facing any issue, kindly create JSFiddle reproducing the issue you are facing so that we can look in to it and help you out.
—
Vishwas R
Team CanvasJSSimilar to how wheel event was attached to achieve zooming the chart with mouse-wheel, you need to attach keydown event to achieve on pressing any key in the keyboard. Please take a look at this JSFiddle. Please refer this stackoverflow thread for more information on key-codes.
Note: As JSFiddle has multiple panels (like HTML, JS, Result, etc), make sure you click somewhere in the result panel and then on top of chart once so that keyboard events are captured by chart.

—
Vishwas R
Team CanvasJSIn the JSFiddle that you have shared, it’s not possible to observe dataPoints as you are setting markerBorderColor to white (same as chart background). In your scenario, dataPoints are too close that the marker-border of one dataPoint is rendered on top of marker of another dataPoint. Either by removing markers when there are too-many dataPoints in the viewport (which is a default behavior) or removing markerBorderColor / markerBorderThickness should work fine in your case. Please take a look at this updated JSFiddle.

—
Vishwas R
Team CanvasJSYou can use scale-breaks to remove space between dataPoints and allow dataPoints accommodate more space within the plot-area. Please take a look at this updated JSFiddle.

—
Vishwas R
Team CanvasJSThanks for reporting the use-case. We are looking into the issue and will get back to you at the earliest.
—
Vishwas R
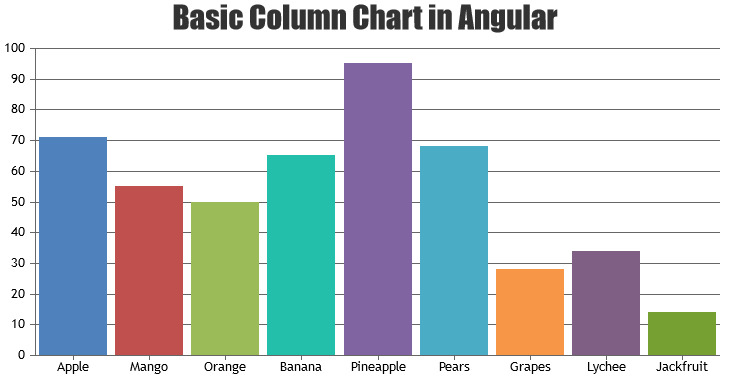
Team CanvasJSCanvasJS Charts seems to be working fine with Angular. Please take a look at this sample project and check-out Gallery for more examples.
If the issue still persists, kindly create a sample project reproducing the issue and share it with us over Google-Drive or Onedrive, so that we can run it locally at our end to understand the scenario better and help you out.
—
Vishwas R
Team CanvasJSThanks for reporting the use-case. As of now, columns/dataPoints are getting disappeared when the values are pretty small compared to the axis range. In future versions, we will consider limiting the height of the column to a minimum pixel value so that it’s visible even in-case of smaller values.
—
Vishwas R
Team CanvasJS