Login to Ask a Question or Reply
Forum Replies Created by Vishwas R
-
You can use stripLines to highlight the area according to your requirements.
—
Vishwas R
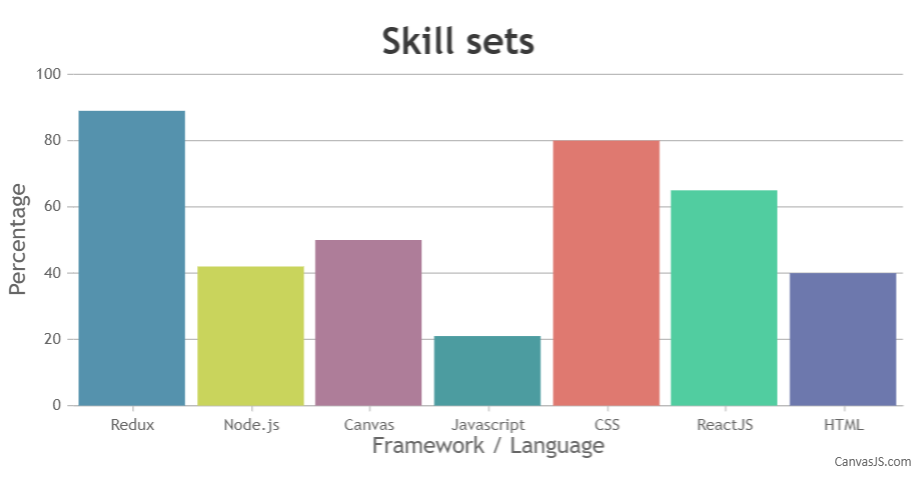
Team CanvasJSYou can update the chart option according to the drop-down value to achieve this. Please take a look at this JSFiddle which shows updating colorSet based on dropdown value.
If this doesn’t help you to fulfill your requirements, kindly share JSFiddle with sample data and brief us what do you mean by changing the content so that we can understand it better and help you out.
—
Vishwas R
Team CanvasJSThe solution seems to be working fine with all chart types including column, line, area charts.
—
Vishwas R
Team CanvasJSCan you kindly share pictorial representation and brief us more about your requirement, so that we can understand it better and help you out?
—
Vishwas R
Team CanvasJSMay 2, 2019 at 12:14 pm in reply to: How to restrict width of shared tooltip when data series has a long name? #25044Michael,
You can customize the width of tooTip by adding style to ‘canvasjs-chart-tooltip’ class. Please take a look at this JSFiddle.
—
Vishwas R
Team CanvasJSTo create a chart with draggable dataPoints you can attach event handlers to div with id
"canvasjs-react-chart-container-0"in React so as to perform necessary actions when user clicks or drags inside the div as shown in the code snippet below:$("#canvasjs-react-chart-container-0 > .canvasjs-chart-container").on({ mousedown: function(e) { _this.mouseDown = true; _this.getPosition(e); _this.searchDataPoint(); }, mousemove: function(e) { _this.getPosition(e); if(_this.mouseDown) { clearTimeout(_this.timerId); _this.timerId = setTimeout(function(){ if(_this.selected != null) { chart.data[0].dataPoints[_this.selected].y = _this.yValue; chart.render(); } }, 0); } else { _this.searchDataPoint(); if(_this.changeCursor) { chart.data[0].set("cursor", "n-resize"); } else { chart.data[0].set("cursor", "default"); } } }, mouseup: function(e) { if(_this.selected != null) { chart.data[0].dataPoints[_this.selected].y = _this.yValue; chart.render(); _this.mouseDown = false; } } });Please take a look at this Sample Project for a working example with sample code.
Considering this as duplicate of React CanvasJS: Drag Data Points and closing the thread.
—
Vishwas R
Team CanvasJSPlease take a look at this Sample Project.
Considering this as duplicate of React CanvasJS: Drag Data Points and closing the thread.
—
Vishwas R
Team CanvasJSTo create a chart with draggable dataPoints you can attach event handlers to div with id
"canvasjs-react-chart-container-0"in React so as to perform necessary actions when user clicks or drags inside the div as shown in the code snippet below:$("#canvasjs-react-chart-container-0 > .canvasjs-chart-container").on({ mousedown: function(e) { _this.mouseDown = true; _this.getPosition(e); _this.searchDataPoint(); }, mousemove: function(e) { _this.getPosition(e); if(_this.mouseDown) { clearTimeout(_this.timerId); _this.timerId = setTimeout(function(){ if(_this.selected != null) { chart.data[0].dataPoints[_this.selected].y = _this.yValue; chart.render(); } }, 0); } else { _this.searchDataPoint(); if(_this.changeCursor) { chart.data[0].set("cursor", "n-resize"); } else { chart.data[0].set("cursor", "default"); } } }, mouseup: function(e) { if(_this.selected != null) { chart.data[0].dataPoints[_this.selected].y = _this.yValue; chart.render(); _this.mouseDown = false; } } });Please take a look at this Sample Project for a working example with sample code.
—
Vishwas R
Team CanvasJSbased on the JSON that you have shared, passing name as label and age as y-value should work fine. Below is the code snippet.
function parseData(jsonData){
	for(var i = 0; i < jsonData.length; i++) {
		dataPoints.push({ label: jsonData[i].name, y: Number(jsonData[i].age)});
	}
}
Please take a look at this updated sample project for working code.
—
Vishwas R
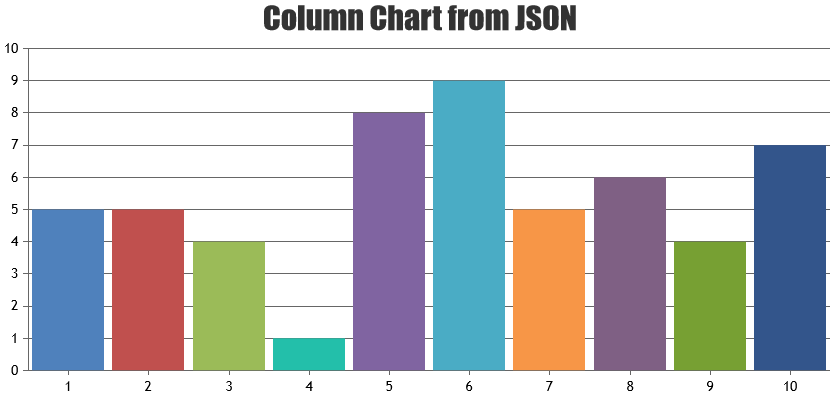
Team CanvasJSParsing the dataPoints to the format accepted by CanvasJS before passing it to chart-options should work fine in this case.
for (var i = 0; i <= result.length - 1; i++) {
  dataPoints.push({ x: Number(result[i].x), y: Number(result[i].y) });
}
Please take a look at this JSFiddle for rendering chart from JSON object.
If you are still facing issue, kindly share sample project along with sample JSON over Google-Drive or Onedrive, so that we can look into it and help you out.
—
Vishwas R
Team CanvasJSOne of our tech representative will contact you over email with appropriate solution.
—
Vishwas R
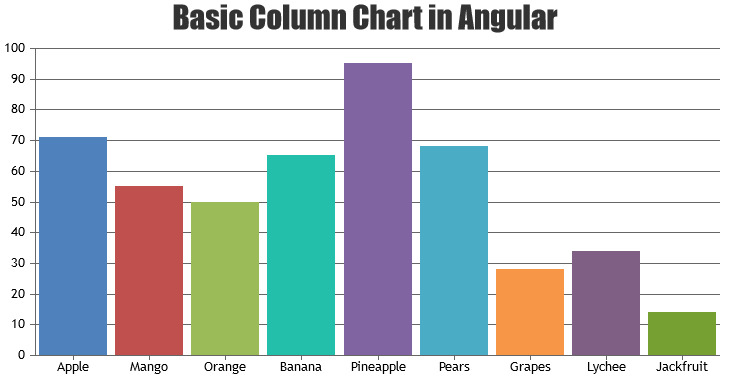
Team CanvasJSCanvasJS Charts & StockCharts works with all versions of Angular / AngularJS including Angular 6. Below are the steps to integrate CanvasJS Chart / StockChart in your angular app.
1. Save canvasjs.min.js (canvasjs.stock.min.js incase of StockChart) within source-folder of your Angular application ( src or src/assets or src/lib )
2. Import the library into your app.
For Chart:import * as CanvasJS from './canvasjs.min';
For StockChart:import * as CanvasJS from './canvasjs.stock.min';Please check out Angular Gallery for examples on integrating charts in Angular app.
—
Vishwas R
Team CanvasJSYou can publish Google-Sheet as csv and use the url generated to fetch data using jQuery AJAX as shown in this JSFiddle.
—
Vishwas R
Team CanvasJSWe recommend you to use the latest version of CanvasJS as we keep our library updated in sync with browsers update and also improve the library by adding new features.
—
Vishwas R
Team CanvasJSPlease take a look at this sample project for creating dynamic charts using data from MySQL database in PHP. Also, please refer to this documentation page on creating a Live Updating Charts from JSON API & AJAX.
—
Vishwas R
Team CanvasJS