[Update] We have just released v1.9.5 Beta which supports Secondary X Axis and Multiple X / Y Axis. Please refer to the release blog for more information.
Hi Schuerle,
As of now we don’t support multiple axes at a side and a secondary x-axis but these features are on our road map and would be implemented in the future.
Hi Iggy,
Yes, you can set the viewportMinimum and viewportMaximum values to display only the last x minutes. Here is an example jsfiddle where the graph shows only the last 5 minutes.
Xuefer,
You can use content and CSS to align tooltip content. Here is a jsfiddle example.
@sbefort,
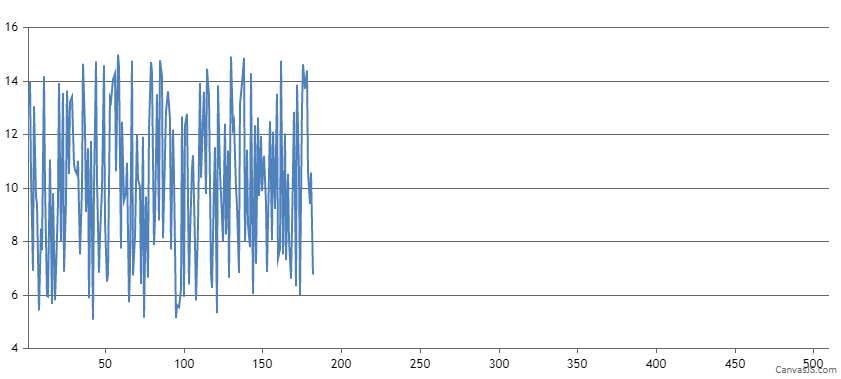
You can avoid cliping of axis labels towards end by setting maximum value of x-axis to 510 which will add some padding towards the right side of the axis.
axisX: { maximum: 510, . . }
Please take a look at this JSFiddle for complete code.
—- Rishabh Team CanvasJS
Yes you can use external file to specify data for CanvasJS. Please refer this link for the same.
I think you can use labels instead of x value in this case and use formatDate method in order to format date values as required and use labelFormatter for further customization.
Here is the JSFiddle example.
Scanner,
The link you have provided is broken. And please let us know if the solution provided previously solved the issue.