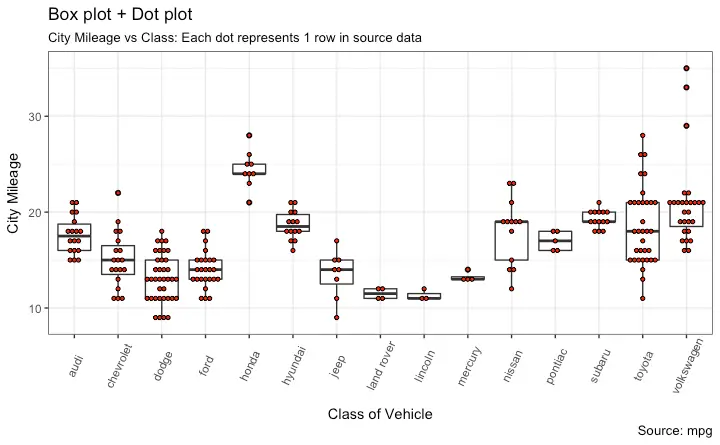
Many thanks for that, however dot & box plots are becoming more fashionable as a means of presenting simultaneously the raw data and the statistical summary. For example,
The same principle of plotting raw data as dots inside the width of a column is also an important means of conveying information. I was informed by one of your colleagues that scatter plot could be used to show outliers and other data points in combination with a multi-series column graph, but I was unable to make this work.
This reply was modified 7 years, 7 months ago by GrantWray.
This reply was modified 7 years, 7 months ago by GrantWray.
This reply was modified 7 years, 7 months ago by GrantWray.