Login to Ask a Question or Reply
Forum Replies Created by dpanscik
-
@Manoj Mohan
I got this working. There is allot of proprietary details that I couldn’t show you that was making the label overlay more complex. I kept going back to your fiddle example and I got it all figured out.
Thank you for your assistance. Much appreciated.
@Manoj Mohan
Thank you for your continued assistance.For other reasons window.onload does not work for this application. I instead need to use document.ready function.
When I replace window.onload with document.ready the sample does not work.
see fiddle for same example using document.ready
@Manoj Mohan
Use of div resizing seems to break the static labels
var destCtx = $(‘#’ + destId)
.get(0)
.getContext(‘2d’);
The error is on line 53 of the fiddle.
Here is a fiddle that helps to replicate this error.
https://jsfiddle.net/c5stbx86/1/What do you think?
Hi Manoj,
Now I am getting an error TypeError: Cannot read properties of undefined (reading ‘getContext’)
`
var destCtx = $(‘#’ + destId)
.get(0)
.getContext(‘2d’);
`The error is on line 53 of the fiddle.
Here is a fiddle that helps to replicate this error.
https://jsfiddle.net/c5stbx86/1/Hi Manoj,
Here is a fiddle showing the code that I am using.
https://jsfiddle.net/sqvgocez/
The error (chartname) is not defined.
The error is at; (chartname).axisX[0].bounds.x2
Thank you for having a look at this.
Much appreciated.This seems to work in fiddle but in visual studio, I get the following error;
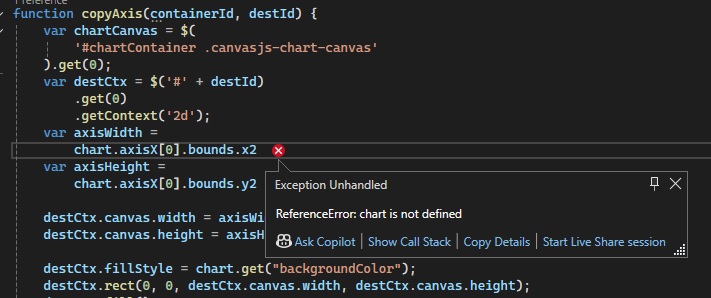
I had forgotten that bar charts have X & Y reversed.
Thank you for the assistance!
@Manoj Mohan
Oops. The previous fiddle I created for you did not autosave.
Here is a fiddle that shows the issue I am having. The overlay canvas image is never created.
Here is a fiddle. https://jsfiddle.net/canvasjs/QwZuf/
I tried to drop the necessary code into a existing javascript canvas.js project and I am getting an error.
TypeError: Cannot read properties of undefined (reading ‘0’)
I believe this section is throwing an error. Have you seen this before?
`
var axisWidth =
stockChart.charts[0].axisY[0].bounds.x2 +
stockChart.charts[0].axisY[0].get(‘tickLength’);
var axisHeight =
stockChart.charts[0].height –
stockChart.charts[0].axisY[0].bounds.y1;
`Thanks Manoj,
Why do you define
dataPoints2 = [];is it used somewhere that is not visible in this example?Can someone show me how to make y axis labels stationary?
This fiddle (copied and modified from above) https://jsfiddle.net/svc51ym8/ has labels on x axis stationary.
I would like to learn how to make y axis labels stationary.
Thank you Manoj
Your syntax didnt get me there but helped by giving me some more options to try. I suspect your solution needs to be placed in a exact location of the chart’s functions for it to work.
This is what I would up with that is working by placing at the end of the function: function addData(data){}
pageName = dataPoints[0].extraData;
alertMessage = dataPoints[1].extraData;I have the stripline label coming in on a JQUERY datapoint named stripLineLabel
I am trying to figure out how to use this syntax can you help?
stripLines: [ { startValue: centerLine-43200000, endValue: centerLine + 43200000, thickness: 2, color: "#555555", label: "Today: " + dataPoint.stripLineLabel[0], labelFontColor: "#a8a8a8" }]stacked stacked rangebar and sorting seems to be an issue.
I couldnt get sorting working with stacked rangebar.
I decided instead to do the sorting within the MVC controller before pushing the data to the chart.
Problem solved.