Login to Ask a Question or Reply
Forum Replies Created by Bivek Singh
-
Ryan,
Sorry, controlling height of stripline is not available as of now.
—-
Bivek Singh,
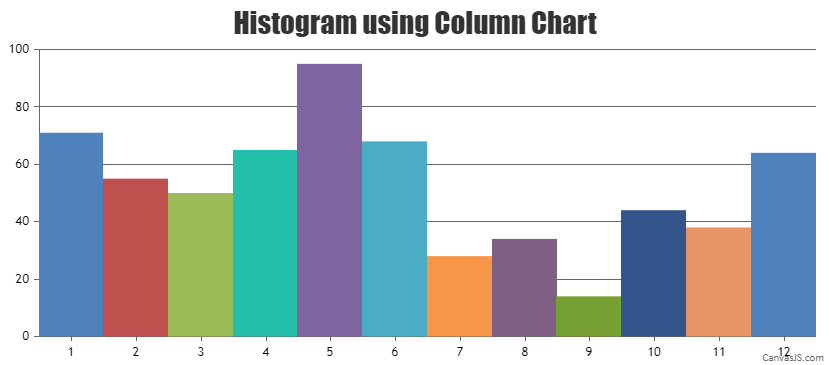
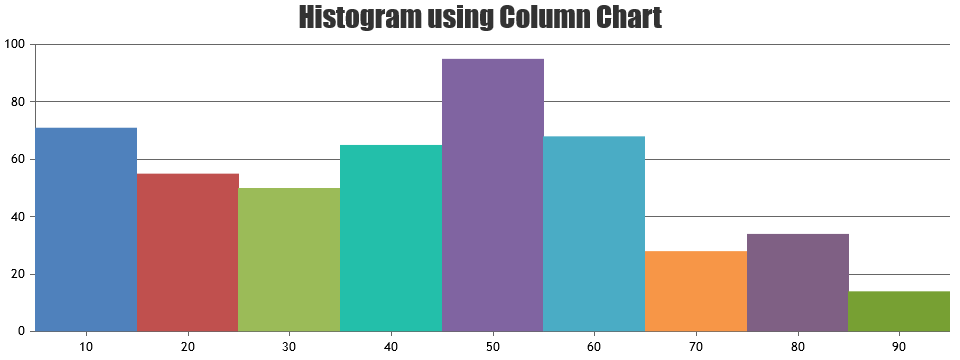
Team CanvasJSWe don’t have control over the gaps between columns directly, as of now. However, you can achieve the same by using dataPointWidth and varying the width of columns. You can also take a look at this JSFiddle for reference.
—-
Bivek Singh,
Team CanvasJSDate time for Y Axis is not supported, as of now. However, you can use this workaround to achieve the same.
—-
Bivek Singh,
Team CanvasJSI’m sorry but We don’t support multiple level axis labels, as of now.
—-
Bivek Singh,
Team CanvasJSSorry, about the late response. We are looking into the issue and will get back at the earliest.
—-
Bivek Singh,
Team CanvasJSYes, it is possible to convert d3 to CanvasJS. You need to format the data as required by CanvasJS. Please take a look at this documentation page.
—-
Bivek Singh,
Team CanvasJSYou have missed a comma after labelFormatter function. Hope that solves the problem.
—-
Bivek Singh,
Tema CanvasJSThis feature is not available out of the box, as of now but, you can take a look at this work-around.
—-
Bivek Singh,
Team CanvasJS@Cristi,
Thank you for reporting this. We are looking into it and will get back to you at the earliest.
—-
Bivek Singh,
Team CanvasJSCristi,
Funnel chart is in our road-map and will be released as part of our next version 2.0. It is still in implementation phase.
Please contact us over email in a week or two and we can give you an internal build.For now, you can use this work-around to show labels in the middle of each bar.
—-
Bivek Singh,
Team CanvasJS