Login to Ask a Question or Reply
You must be logged in to post your query.
Home › Forums › Feature Requests & Feedback › Multiple dynamic data
Multiple dynamic data
- This topic has 4 replies, 3 voices, and was last updated 11 years, 2 months ago by
Aakash.
-
May 21, 2015 at 4:36 pm #8988
This code does not work HELP ME
function displayChart(datapointss){
var chart = new CanvasJS.Chart(“chartContainer”,
{
zoomEnabled: false,
animationEnabled: true,
title:{
text: “PROJECTS”
},
axisY2:{
valueFormatString:”0.0 days”,// maximum: 1.2,
// interval: .2,
interlacedColor: “#F5F5F5”,
gridColor: “#D7D7D7”,
tickColor: “#D7D7D7”
},
theme: “theme2”,
toolTip:{
shared: true
},
legend:{
verticalAlign: “bottom”,
horizontalAlign: “center”,
fontSize: 15,
fontFamily: “Lucida Sans Unicode”},
data:datapointss
,
legend: {
cursor:”pointer”,
itemclick : function(e) {
if (typeof(e.dataSeries.visible) === “undefined” || e.dataSeries.visible) {
e.dataSeries.visible = false;
}
else {
e.dataSeries.visible = true;
}
chart.render();
}
}
});chart.render();
}function getConsolidation(){
var data = [];
var projects = [“SFR” , “MANAGEMENT”];
var dataSeries = {type: “line”};
var obj = [];
$.each(projects , function(n) {
$.ajax({
url: “php/charger.php”,
data: “projet=”+ projects[n],
type: “POST”,
success : function (result){
//obj = [{type : “column”} , {lineThickness : 3} , {axisYType:”secondary”} , {showInLegend:true} , {name: projects[n]} , {dataPoints: $.parseJSON(result)} , {“” : “,”}] ;
obj.push($.parseJSON(result));
}
});
});
data.push(dataSeries);
dataSeries.dataPoints = obj;
displayChart(data);
}May 25, 2015 at 8:06 pm #9028Without knowing the JSON data its not possible to figure out the issue. Can you please post a sample JSON response?
__
AnjaliMay 25, 2015 at 8:40 pm #9029Thank you very much for your answer.
I’ve changed a bit my code
1- is my load function
function displayChart(datapointss){
alert(datapointss);
var chart = new CanvasJS.Chart(“chartContainer”,
{
zoomEnabled: false,
animationEnabled: true,
title:{
text: “PROJECTS”
},
axisY2:{
valueFormatString:”0.0 days”,
interlacedColor: “#F5F5F5”,
gridColor: “#D7D7D7”,
tickColor: “#D7D7D7”
},
theme: “theme2”,
toolTip:{
shared: true
},
legend:{
verticalAlign: “bottom”,
horizontalAlign: “center”,
fontSize: 15,
fontFamily: “Lucida Sans Unicode”
},
data:[{
datapointss
}
]
,
legend: {
cursor:”pointer”,
itemclick : function(e) {
if (typeof(e.dataSeries.visible) === “undefined” || e.dataSeries.visible) {
e.dataSeries.visible = false;
}
else {
e.dataSeries.visible = true;
}
chart.render();
}
}
});chart.render();
}
2 – ajax function
function function1(tab){
return $.ajax({
type: ‘POST’,
url: ‘php/load.php’,
dataType: ‘json’,
data: ‘projet=’+ tab,
error: function(){
alert(‘impossible de chercher ce project’);
},
success: function(json){}
});
}3 – the data construction function in JSON format
function getConsolidation(){
var results = [];
var list = [“SFR” , “MANAGEMENT”];
for(f in list){
results.push(function1(list[f]));
}
$.when.apply(this , results).done(function() {
var table = [];
var values = “”;
for (var i = 0; i < list.length; i++) {
values += ‘”type” : “line”, “showInLegend” : “true”, “name” : “‘+ list[i] +'” ,”dataPoints” : ‘+ results[i].responseText +’,’;
}
//for (var i=0; i<values.length; i++) {
console.log(values);
displayChart(values);
//}//displayChart(values);
//values.replace(/(\s+)?.$/, ”);// Pour supprimer ‘,’ a la fin de la chaine
});
}and this is JSON :
[{“type” : “line”, “showInLegend” : “true”, “name” : “name1″ ,”dataPoints” : [{“x”:”2015-3-01″,”y”:34},{“x”:”2015-4-01″,”y”:41},{“x”:”2015-5-01″,”y”:23.800000026822}]
,”type” : “line”, “showInLegend” : “true”, “name” : “name2″ ,”dataPoints” : [{“x”:”2015-2-01″,”y”:14},{“x”:”2015-3-01″,”y”:37},{“x”:”2015-4-01″,”y”:39.20000000298},{“x”:”2015-5-01″,”y”:50.10000000149}]
}]and of course once again it does not work with any error HELP ME
May 28, 2015 at 8:24 pm #9047Hello,
After looking into your code we found couple of issues. Please correct the below mentioned issues:
1) You are adding both the series inside same object while they should be two different objects as shown below.
`[
{
“type”: “line”,
“showInLegend”: “true”,
“name”: “name1”,
“dataPoints”: [
{ “x”: “2015-3-01”, “y”: 34 },
{ “x”: “2015-4-01”, “y”: 41 },
{ “x”: “2015-5-01”, “y”: 23.800000026822 }
]
},
{
“type”: “line”,
“showInLegend”: “true”,
“name”: “name2”,
“dataPoints”: [
{ “x”: “2015-2-01”, “y”: 14 },
{ “x”: “2015-3-01”, “y”: 37 },
{ “x”: “2015-4-01”, “y”: 39.20000000298 },
{ “x”: “2015-5-01”, “y”: 50.10000000149 }
]
}
]`2) In your JSON data, x values are in string form which you need to convert back to Number/Date before assigning it to the chart as shown below.
function displayChart(data) {
	for (var i = 0; i <= data.length - 1; i++) {
		var dataPointss = [];
		for (var j = 0; j <= data[i].dataPoints.length - 1; j++) {
			dataPointss.push({ x: new Date(data[i].dataPoints[j].x), y: data[i].dataPoints[j].y });
		}
		data[i].dataPoints = dataPointss;
		chart.options.data[i] = data[i];
	}
	chart.render();
}
Below is the code with issue fixed:
var chart = new CanvasJS.Chart("chartContainer",
{
	zoomEnabled: false,
	animationEnabled: true,
	title:{
		text: "PROJECTS"
	},
	axisY2:{
		valueFormatString:"0.0 days",
		interlacedColor: "#F5F5F5",
		gridColor: "#D7D7D7",
		tickColor: "#D7D7D7"
	},
	theme: "theme2",
	toolTip:{
		shared: true
	},
	legend:{
		verticalAlign: "bottom",
		horizontalAlign: "center",
		fontSize: 15,
		fontFamily: "Lucida Sans Unicode",
		cursor:"pointer",
		itemclick : function(e) {
		if (typeof(e.dataSeries.visible) === "undefined" || e.dataSeries.visible) {
			e.dataSeries.visible = false;
		}
		else {
			e.dataSeries.visible = true;
		}
		chart.render();
		}
	},
	data: []
});

function displayChart(data) {
	for (var i = 0; i <= data.length - 1; i++) {
		var dataPointss = [];
		for (var j = 0; j <= data[i].dataPoints.length - 1; j++) {
			dataPointss.push({ label: data[i].dataPoints[j].x, y: data[i].dataPoints[j].y });
		}
		data[i].dataPoints = dataPointss;
		chart.options.data[i] = data[i];
	}
	chart.render();
}

function1();

function function1(){
	return $.ajax({
		type: "GET",
		url: "data1.js",
		dataType: "json",
		error: function(){
			alert("impossible de chercher ce project");
		},
		success: function (json) { displayChart(json); }
	});
}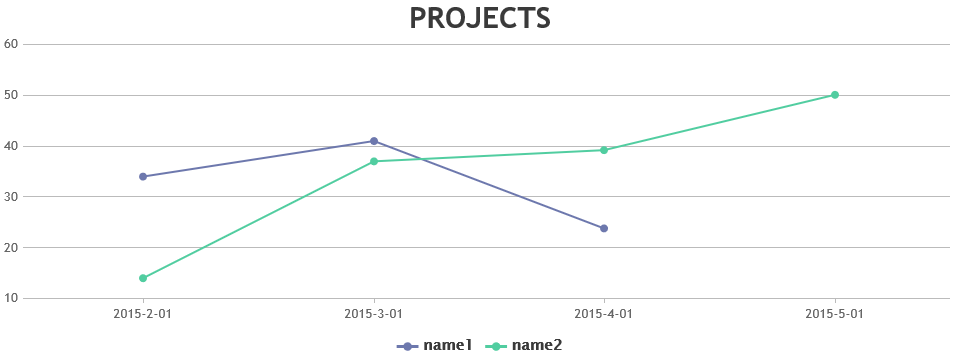
__
AnjaliMay 31, 2015 at 6:20 pm #9050Hello,
I have a return data as JSON object, which is a 2D array. PFB the JSON object for your reference:
[[{“label1″:”09″,”y”:199,”name”:”TEST5″},{“label1″:”16″,”y”:199,”name”:”TEST4″}],[{“label2″:”09″,”y”:825,”name”:”TEST2″},{“label2″:”16″,”y”:301,”name”:”TEST3″}],[{“label3″:”09″,”y”:55,”name”:”09″},{“label3″:”16″,”y”:525,”name”:”Test”}]]Could you please let me know how to send it as different dataseries, to make a Stacked Column ?
Thanks..
You must be logged in to reply to this topic.