Login to Ask a Question or Reply
Forum Replies Created by Ananya
-
CanvasJS chart renders whatever datapoints are passed in chart-options. Generating the datapoints using the python library suggested in the article, and passing it to the chart should work in your case.
—
Ananya Deka
Team CanvasJSDecember 9, 2024 at 10:31 am in reply to: Problem with tooltip and “shared=true” with stackedArea #60264[UPDATE]
@rck,We have released chart v3.10.19 with the above fix. Please refer to the release blog for more information. Do download the latest commercial version from My Account Page and let us know your feedback.
—
Ananya Deka
Team CanvasJSPlease make sure that the CDN you are using in your project is that of stockchart (https://cdn.canvasjs.com/canvasjs.stock.min.js). If you are still facing issue after that, kindly check the browser console for any errors and let us know, so that we can understand the scenario better and help you out.
—
Ananya Deka
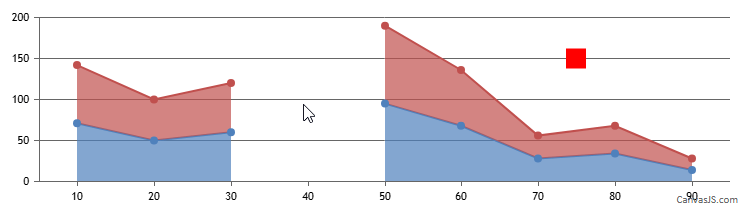
Team CanvasJSNovember 29, 2024 at 5:44 pm in reply to: Problem with tooltip and “shared=true” with stackedArea #60227@rck,
Thank you for reporting the use case, we will look into it further. Meanwhile, you can work around this by adding a datapoint in the scatter chart with the concerned x value, and set y value as null, so that tooltip is not shown in that region.
Please take a look at this updated JSFiddle for the working example of the same.
—
Ananya Deka
Team CanvasJS@arj,
Can you kindly create a sample project reproducing the issue and share it with us over Google-Drive or Onedrive so that we can run it locally at our end to understand scenario better, and help you out?
—
Ananya Deka
Team CanvasJSasbuka,
Date-time values over y axis is not supported as of now. However, formatting the timestamp values to show it as date-time using labelFormatter should work fine in this case. Please take a look at this JSFiddle for a working example of the same.
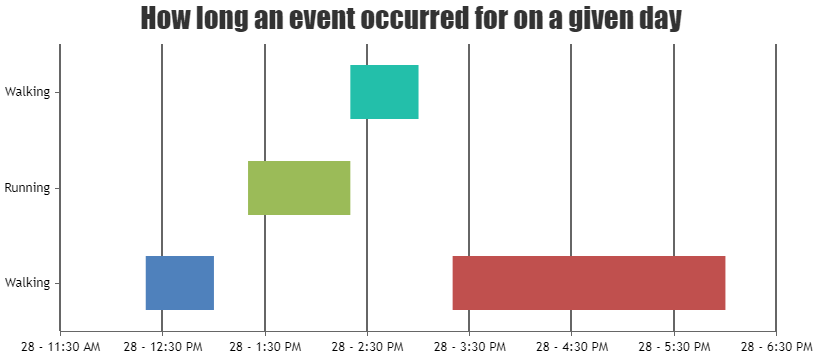
Please refer to this article for more information about creating Gantt Charts.
—
Ananya Deka
Team CanvasJSWe have released v3.10.15 GA with the fix for this bug. Please refer to the release blog for more information.
Do download the latest version from download page & let us know your feedback.
—
Ananya Deka
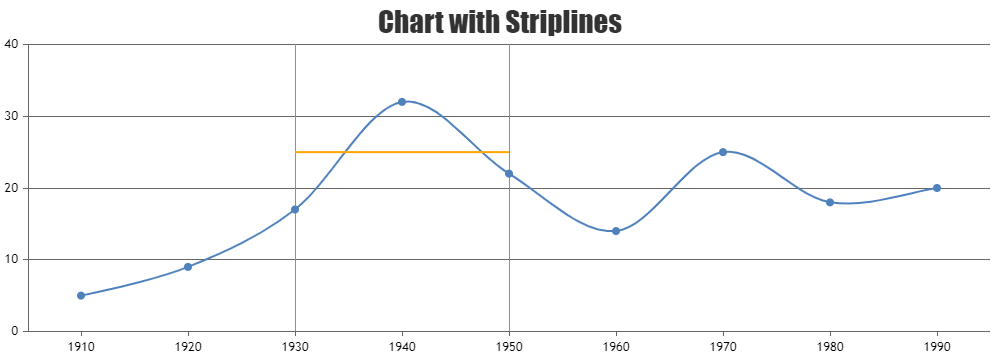
Team CanvasJSchart.addTo() method is used to add the line dataseries programmatically, as shown in the example. The code you are trying does not work because the series needs to be created before “type” or “datapoints” can be assigned.
If you are looking to change the y-values such that the line is centered vertically, you can use the y-axis range to calculate the midpoint. In case you are still having issues, please create a JSFiddle and share with us, so that we can understand your scenario better and help you out.
—
Ananya Deka
Team CanvasJSSetting legendMarkerType as ‘triangle’, and legendMarkerColor as ‘white’ seems to be working fine, and creates a dashed line legend marker. You can take a look this JSFiddle for the complete example.
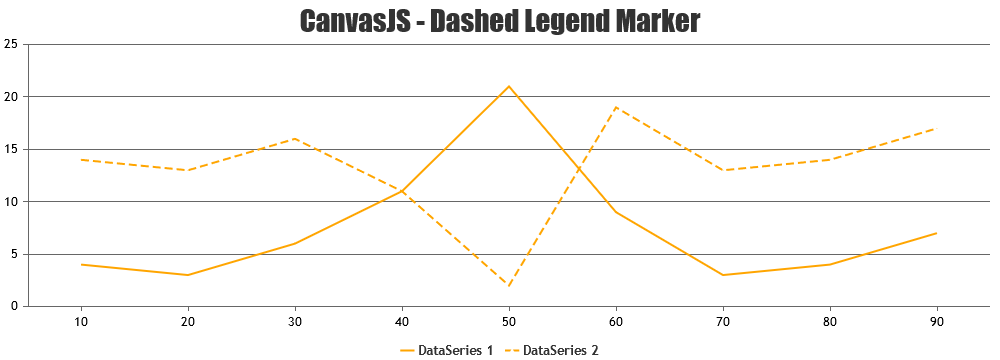
If you are still facing any issue, please share a JSFiddle reproducing your use case, so that we can look into it and help you out.
—
Ananya Deka
Team CanvasJS-
This reply was modified 1 year, 9 months ago by
Ananya.
Please refer to this Stack Overflow thread for more information on fetching last 24 hours’ data from database. You can pass the fetched data to the chart and render it.
—
Ananya Deka
Team CanvasJSPlease take a look at this gallery page for an example on rendering chart with data fetched from MySQL database. you can also refer to this page for an article about the same.
—
Ananya Deka
Team CanvasJSYou can get a reference to the chart instance and use it to update the data. Please take a look at this StackBlitz for an example of the same. You can also take a look at this gallery page for more examples of dynamic charts.
—
Ananya Deka
Team CanvasJS -
This reply was modified 1 year, 9 months ago by