@malvipanchal,
The precision level of Axis-Y labels depends on multiple factors such as range of axis(minimum and maximum), interval and the dataSeries, etc.
You can change axis label’s decimal value precision by setting valueFormatString as shown below:
axisY:{
	valueFormatString: "###0.00", //axisY labels with values upto two decimal places
}
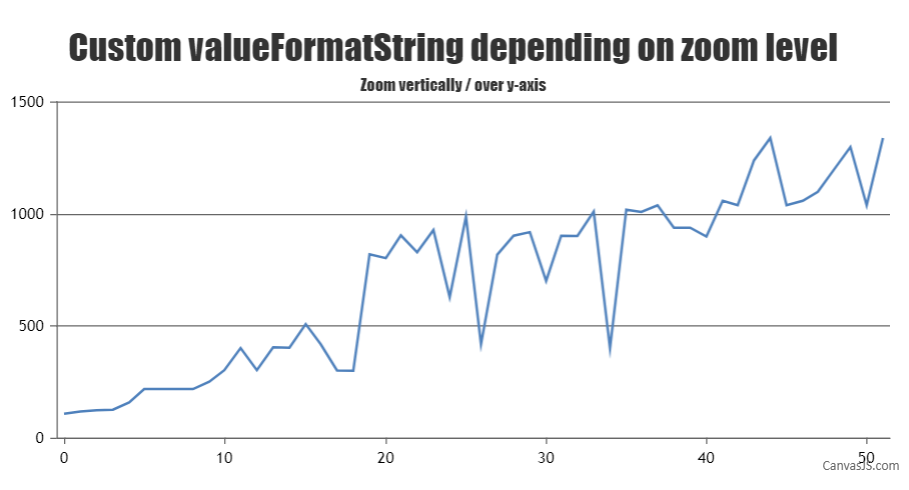
While zooming, you can further increase or decrease the precision of axis labels based on the zoom level by updating valueFormatString when the rangeChanged event is triggered. The code snippet below shows how you can achieve the same:
function customAxisLabel(e) {

  var viewportRange = e.chart.axisY[0].viewportMaximum - e.chart.axisY[0].viewportMinimum;

  if(!e.chart.options.axisY)
    e.chart.options.axisY = {};

  if(e.trigger === "reset") {
    e.chart.options.axisY.interval  = null;
    e.chart.options.axisY.valueFormatString = "####0"
  }
  else {
    if(viewportRange > 1000) {
      e.chart.options.axisY.valueFormatString = "###0";
    }
    else if(viewportRange <= 1000 && viewportRange > 100) {
      e.chart.options.axisY.valueFormatString = "###0.00";
    }
    else {
      e.chart.options.axisY.valueFormatString = "###0.0000";
    }
  }

  chart.render();

}
Please take a look at this JSFiddle for a working example with a sample code.
—
Shashi Ranjan
Team CanvasJS
.