Home Forums Chart Support Volume-by-Price (Bar Chart) & Candlestick chart

Volume-by-Price (Bar Chart) & Candlestick chart

Viewing 5 posts - 1 through 5 (of 5 total)
  • #25859

    Hello!
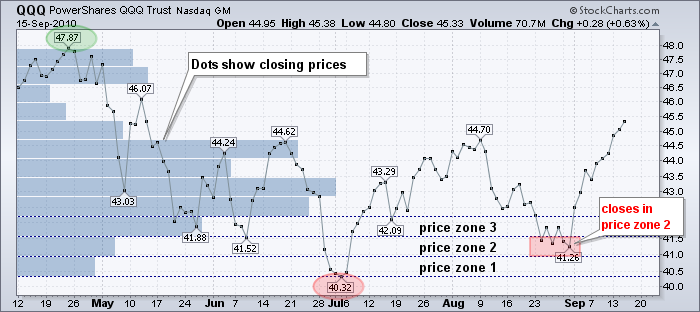
    I need to draw two graphs on one sheet: Volume-by-Price (Bar Chart) & Candlestick chart.

    Data on the volume, depending on the price taken from the last day:

    I have two functions:
    Price (candlestick) = f(date)
    Volume = f(price) from last date

    #25860

    Is it possible to draw a horizontal bar chart using the canvas.js?
    Bar Chart by Price Intervals.

    #25863

    @ivan-shamaev,

    Sorry, combination of line and horizontal bar (bar chart) is not possible as of now. However you can combine vertical bar (column chart) and line chart, please take a look at this example.


    Vishwas R
    Team CanvasJS

    #25866

    Is it possible to make the column graph horizontal?

    #25905

    @ivan-shamaev,

    Column charts are rectangular bars with lengths proportional to the values that they represent – which are vertical whereas bar charts are horizontal. Column and Bar charts have different orientations which can’t be changed.


    Vishwas R
    Team CanvasJS

Viewing 5 posts - 1 through 5 (of 5 total)

You must be logged in to reply to this topic.