Login to Ask a Question or Reply
You must be logged in to post your query.
Home › Forums › Chart Support › Two stripLines on one chart!
Two stripLines on one chart!
- This topic has 7 replies, 2 voices, and was last updated 5 years, 2 months ago by
OlegLR.
Tagged: Two stripLines
-
May 9, 2021 at 1:48 am #34265
Good day! Please tell me the code for creating a second dynamic line on one chart. I am trying to repeat the code of the first line, but I cannot display two lines on the chart at the same time!
I want to make Two stripLines on one chart!
document.querySelector(“#digits > span:nth-child(“+i+”)”).innerHTML = digit[i];
yVal2 = parseFloat(spot[20]);
if(yVal2==Math.max.apply(null,spot)){
var HdThick= “up”;
mColorHead = “#1439ff”;
if (spot[i+17] > spot[i+16]) {
//console.log( ” above – head blue”);
LDigit = digit[20];
LDigit_0 = digit[19];
var classCol =”blue”;
if (LDigit_0 > 5 && LDigit == 0) {
ClassNum = 10;
}if (LDigit_0 < 5 && LDigit == 0){
ClassNum = 0;
}if (LDigit != 0){
ClassNum = LDigit;
}} else if(spot[i+17] < [i+16]) {
//console.log(“Worm head blue: Tick Return Down”);
} else if(spot[i+17] == spot[i+16]) {
//console.log(“Worm head blue: Tick Flat”);
}//Level digit Red
}else if(yVal2==Math.min.apply(null,spot)){
var HdThick= “down”;
mColorDigit = “#ff1439”;
//removeClass();
if (spot[i+17] > spot[i+16]) {
//console.log(“Worm head red: Tick Return Up”);
} else if(spot[i+17] < spot[i+16]) {
LDigit = digit[20];
LDigit_0 = digit[19];
var classCol =”red”;
if (LDigit_0 > 5 && LDigit == 0){
ClassNum = 10;
}if (LDigit_0 < 5 && LDigit == 0){
ClassNum = 0;
}if (LDigit != 0) {
ClassNum = LDigit;
}} else if(spot[20] == spot[i+16]) {
//console.log(“Worm head red: Tick Flat”);
}}else{
var HdThick= “mid”;
//removeClass();
//Between Level digit Redif (spot[i+17] > spot[i+16]) {
//console.log(“Worm head green:Tick UP”);
LDigit = digit[20];
LDigit_0 = digit[19];
var classCol =”blue_green”;
if (LDigit_0 > 5 && LDigit == 0) {
ClassNum = 10;
} if (LDigit_0 < 5 && LDigit == 0) {
ClassNum = 0;
} if (LDigit != 0){
ClassNum = LDigit;
}//Between Level digit Blue
} else if(spot[i+17] < spot[i+16]) {
//console.log(“Worm head green:Tick Down”);
LDigit = digit[20];
LDigit_0 = digit[19];
var classCol =”red_green”;
if (LDigit_0 > 5 && LDigit == 0) {
ClassNum = 10;
}if (LDigit_0 < 5 && LDigit == 0){
ClassNum = 0;
}if (LDigit != 0){
ClassNum = LDigit;
}} else if(spot[i+17] == spot[i+16]) {
//console.log(Worm head green:Tick Flat);
}}
if (spot[i-1] < spot[i]) {
toggleDigit(i,”up”);
if(digit[i] !=0) {
var tic2nd= (digit[i]*1);
}
if (((digit[i-1]) > 5) && digit[i] ==0) {
var tic2nd= (10);
}
if (((digit[i-1]) <= 5) && digit[i] ==0) {
var tic2nd= (0);
}
if(i==cnt){
result.push({x:digit[i],is:isEven(digit[i]),minus:false})
getSignal();
}
} else if(spot[i-1] > spot[i]) {
toggleDigit(i,”down”);
if(i==cnt){
result.push({x:digit[i]*-1,is:isEven(digit[i]),minus:true})
getSignal();
}
if(digit[i] !=0) {
var tic2nd= (digit[i]*-1);
}
if (((digit[i-1]) > 5) && digit[i] ==0) {
var tic2nd= (-10);
}
if (((digit[i-1]) <= 5) && digit[i] ==0) {
var tic2nd= (-0);
}} else if(spot[i-1]==spot[i] && i-1>0) {
if(document.querySelector(“#digits > span:nth-child(“+(i-1)+”)”).className == “digits_moved_up”) {
// toggleDigit(i,”up”);
} else if(document.querySelector(“#digits > span:nth-child(“+(i-1)+”)”).className == “digits_moved_down”) {
// toggleDigit(i,”down”);
}}
tic.shift(0);
tic.push(tic2nd);}
///////////////////
for (var i=1; i<cnt+1; i++) {
if (spot[i-1] < spot[i]) {
mwColorDigit = “#1439ff”;
//console.log(mwColorDigit);
} else if(spot[i-1] > spot[i]) {
mwColorDigit = “#ff1439”;
//console.log(mwColorDigit);
}mwColorDigitArr.shift(0);
mwColorDigitArr.push(mwColorDigit);
}
////////
//console.log(“T6:”+spot[15]+” , “+”T1:”+spot[20]);
//console.log(“T8:”+spot[13]);
for (var i=1; i<cnt+1; i++) {
var GraphLimit = (cnt-GraphLen);
xDigit = (i);
//console.log(tic[19]);
yDigit = parseFloat(tic[i-1]);
if (spot[i-1] < spot[i]) {
var mwColorDigit = “#0062CB”;
//console.log(mwColorDigit);
} else if(spot[i-1] > spot[i]) {
var mwColorDigit = “#FF0028”;
//console.log(mwColorDigit);
}if ((i <= 13) && (spot[i+2] < spot[i+7])) {
var l2Color = “#002CFF”;
} else if ((i <= 13) && (spot[i+2] > spot[i+7])) {
var l2Color = “red”;
} else{
var l2Color = “black”;
}
//console.log(hdColor.length);
var m2Color = (hdColor[i-1]);
//var l2Colorb = (l2Color[cnt+f-i-1]);
//console.log(digit[20]);
//console.log(lColorARR.length)dps2.push({
x: xDigit,
y: yDigit,indexLabel: digit[i],
indexLabelFontWeight: “bold”,
indexLabelFontSize: 18,
indexLabelFontColor:mwColorDigit,
markerSize: 10,
markerType: “circle”,
markerColor: l2Color,
markerBorderColor: “#00E2FD”,
lineColor: lColorARR[i]
});
}if(dps2.length > GraphLen+1) {
while(dps2.length != GraphLen) {
dps2.shift();
}chart2.options.axisY.stripLines[0].value = spot[0];
chart2.render();spot.reverse();
digit.reverse();}
if(mwColorDigitArr.length > cnt+1) {
while(mwColorDigitArr.length != cnt+1) {
mwColorDigitArr.shift();
}
}
if(WHead.length > cnt+1) {while(WHead.length != cnt+1) {
WHead.shift();
}}
////////////////////////////
if (classIdArr.length ==5){
classIdArr.shift(0);
}classIdArr.push(classCol+”_”+ClassNum);
HdClss.shift();
HdClss.push(HdThick);
hdColor.shift();
hdColor.push(mColor);//////
//////////
for (var i=1; i<cnt+1; i++) {
document.querySelector(“#headcol > span:nth-child(“+i+”)”).innerHTML = digit;
toggleHead(i,HdClss[i-1]);
}for (var i=0; i<cnt+1; i++) {
var GraphLimit = GraphLen;
if (i >= GraphLimit){
if (HdClss[i] == “up”){
var hdStripLine =”#87AFFF”;
}else if (HdClss[i] == “down”){
var hdStripLine =”#FFC0BB”;
}else if (HdClss[i] == “mid”){
var hdStripLine =”#6AEC89″;
}else{var hdStripLine =”#FDFEFE”;
}if (HdClss[19] != 0){
var hdStripLine1 = hdStripLine;
}
WHead.push({
startValue:(i+1.45),
endValue:(i+0.55),
color:hdStripLine1
});}
}
//////////
chart2.render();if(classIdArr.length > 5+1) {
while(classIdArr.length != 5+1) {
classIdArr.shift();
}
}if (classIdArr.length == 5){
toggleGrpDigit(classIdArr[0],classIdArr[1],classIdArr[2],classIdArr[3],classIdArr[4]);
}
else if (classIdArr.length == 4){
toggleGrpDigit(classIdArr[0],classIdArr[1],classIdArr[2],classIdArr[3]);
}
else if (classIdArr.length == 3){
toggleGrpDigit(classIdArr[0],classIdArr[1],classIdArr[2]);
}
else if (classIdArr.length == 2){
toggleGrpDigit(classIdArr[0],classIdArr[1]);
}
else if (classIdArr.length == 1){
toggleGrpDigit(classIdArr[0]);
}};
};
};
chart = new CanvasJS.Chart(“chartContainer”, {
animationEnabled: true,
theme: “dark1”,
backgroundColor: “#1E1E1E”,
display: false,
title: {
titleFontSize: 1,
text: “”
},
toolTip: {
enabled: true,
animationEnabled: true,
borderColor: “#21FFEB”,
borderThickness: 2,
fontColor: “#F40206”,
horizontalAlign: “center”,
shared: true,
labelAutoFit: true,
cornerRadius: 5,
fontweight: “bold”,
horizontalAlign: “center”,
shared: true,
fontSize: 17,
reversed: true,
content: “{y}”
},
axisX: {
includeZero: false,
titleFontSize: 7,
labelFontSize: 7,gridColor: “#432B00″,
borderWidth: 2,
tickLength: 0,
interlacedColor:”rgb(33,21,0)”, /*зебра*/
lineThickness: 1,
lineColor: “#43FFAF”
},
axisY: {stripLines:[{color:”rgb(254,255,7)”,
lineDashType: “dash”,label: “►”,
labelPlacement: “outside”,
labelAlign:”far”,
labelFontColor:”rgb(247,1,67)”,
labelBackgroundColor:”#1E1E1E”,}],
includeZero: false,
titleFontSize: 1,
labelFontSize: 7,
gridThickness: 1,
gridColor: “#070412”,
tickThiскness: 5,
tickLength: 1,
lineThickness: 2,
lineColor: “#43FFAF”
},
data: [{
type: “line”,
lineDashType: “solid”,
lineColor: “#00FFF3”,
lineThickness: 2,
cursor: “crosshair”,
markerType: “cross”,
markerSize: 9,
markerBorderThickness: 1,
dataPoints: dps
}]
});chart2 = new CanvasJS.Chart(“chartContainer2”, {
animationEnabled: true,
theme: “dark1”,
backgroundColor: “#1E1E1E”,
display: false,
title: {
titleFontSize: 1,
text: “Chart_xZ”,
fontSize: 9,
fontColor: “#E0FF00”,
},
toolTip: {
enabled: true,
animationEnabled: true,
borderColor: “#21FFEB”,
borderThickness: 2,
fontColor: “#B1F401”,
fontSize: 26,
fontFamily: “Rockwell Extra Bold”,
shared: true,
borderThickness: 0.1,
cornerRadius: 300,
labelAutoFit: true,
fontweight: “bold”,
opacity: 0.2,
content: “{y}”
},
axisX: {
stripLines:WHead,
includeZero: false,
titleFontSize: 0,/* interlacedColor:”rgba(7,193,240,0.25)”, /*зебра*/
lineThickness: 0.1,
labelFontSize: 0,
},axisY: {stripLines:[{
startValue:-0.05,
endValue:0.05,
color:”rgba(200,255,0,1.00)”,
lineDashType: “dash”,
label: “►”,
labelPlacement: “outside”,
labelAlign:”far”,
labelFontColor:”rgb(247,1,67)”,
labelBackgroundColor:”#432B00″,},
{
color:”rgb(254,255,7)”,
lineDashType: “dash”,
label: “►”,
labelPlacement: “outside”,
labelAlign:”far”,
labelFontColor:”rgb(247,1,67)”,
labelBackgroundColor:”#432B00″,}
],includeZero: false,
titleFontSize: 0,
labelFontSize: 0,
gridThickness: 0,
tickLength: 0,
lineThickness: 0.1,
lineColor: “#43FFAF”,
},
data: [{
type: “line”,
lineColor: “rgb(25,20,41)”,
lineThickness: 2.5,
markerType: “none”,
cursor: “crosshair”,
markerSize: 0,
markerBorderThickness: 0,
dataPoints: dps2
}]
});}, false);
Help me please!
May 9, 2021 at 1:51 am #34266May 10, 2021 at 6:41 pm #34280You can add new stripLines dynamically by using the addTo method. If you like to update the values of the existing stripLines, you can use the set method.
Considering this thread as a duplicate of Help to dynamically bind the stripline to the diagram! and hence closing the same.
—
Adithya Menon
Team CanvasJSMay 10, 2021 at 7:00 pm #34283Thanks for the tip Aditya Menon! I’m not sure what will work out for me, but I will try to add with the methods you suggested.
May 10, 2021 at 11:52 pm #34290Unfortunately, nothing worked for me. Please tell me the correct syntax for adding the second line at the same time as the first. Please show me an example! Thank you!
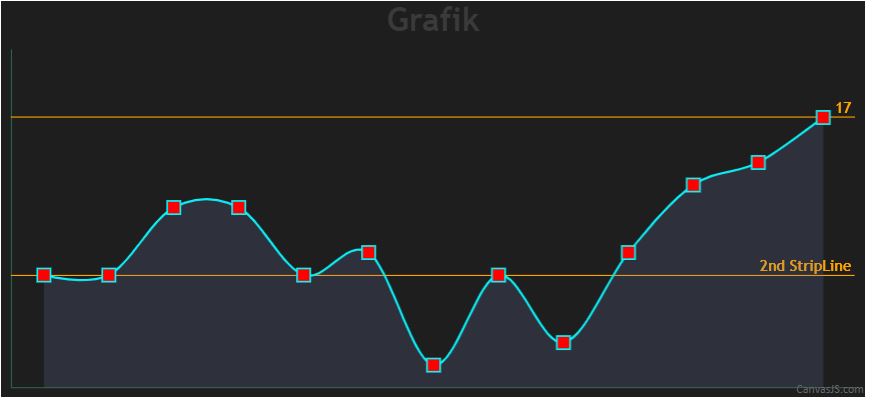
May 11, 2021 at 6:25 pm #34299As mentioned, You can add new stripLines dynamically by using the addTo method as shown in the code-snippet below,
chart.axisY[0].addTo("stripLines", {label: "2nd StripLine", value: 10})Kindly, take a look at this JSFiddle for an example on adding 2 stripLines to a dynamic chart.
—
Adithya Menon
Team CanvasJSMay 11, 2021 at 6:43 pm #34300I am infinitely grateful to you Adithya Menon for your help and tips with examples! You are the best specialist! I will study in detail all the canvasjs documentation, and would like to have a source of typical training examples, which can be used to create your own similar add-ons! Thank you so much!
Tagged: Two stripLines
You must be logged in to reply to this topic.