Login to Ask a Question or Reply
You must be logged in to post your query.
Home › Forums › Chart Support › Help to dynamically bind the stripline to the diagram!
Help to dynamically bind the stripline to the diagram!
- This topic has 5 replies, 3 voices, and was last updated 5 years, 2 months ago by
Adithya Menon.
-
April 2, 2021 at 11:07 pm #33834
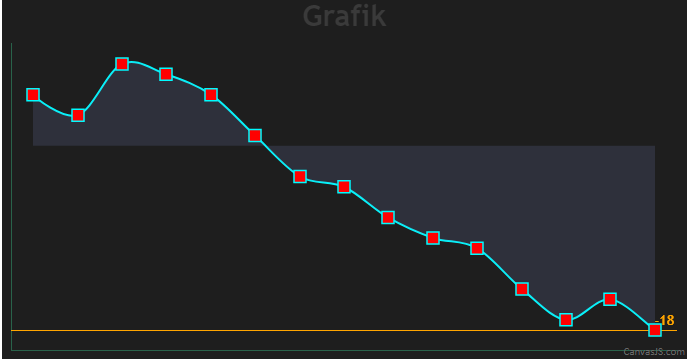
Good day! I want to display a dynamic stripline on a line chart, but I don’t know where to insert the code. Please tell me! As in this example https://canvasjs.com/javascript-stockcharts/dynamic-stockchart-stripline/
chart = new CanvasJS.Chart(“chartContainer”, {
animationEnabled: true,
theme: “light2”,
backgroundColor: “#1E1E1E”,
title: {
titleFontSize: 3,
text: “Grafik”
},
toolTip: {
enabled: true,
animationEnabled: true,
borderColor: “#29F800”,
fillOpacity: 0.1,borderThickness: 2,
fontColor: “#F40206”,
backgroundColor: “#1E1E1E”,
content: “{y}”
},
axisX: {
includeZero: false,
titleFontSize: 0,
labelFontSize: 0,
gridThickness: 0,
tickLength: 0,
lineThickness: 1,
lineColor: “#29624A”
},
axisY: {
includeZero: false,
titleFontSize: 0,
labelFontSize: 0,
gridThickness: 0,
tickLength: 0,
lineThickness: 1,
lineColor: “#29624A”
},data: [{
type: “splineArea”,
toolTipContent: “Price: </b>${y}”,
fillOpacity: 0.2,
/*showInLegend: true,
legendText: “Algorithm xZ & Worm”,*/lineColor: “#00FBFF”,
exportEnabled: true,
lineThickness: 2,
markerType:”square”,markerColor: “red”, markerSize: 12,
opacity: 0.8,
markerBorderThickness: 1.5,
markerBorderColor: “#00FBFF”,
dataPoints: dps}]
});
}, false);
I want to achieve such a line with the current value
https://drive.google.com/file/d/1yK_xYoq_8r2G2kQpr4u0QeG7xqSwvyd7/view?usp=sharing-
This topic was modified 5 years, 3 months ago by
OlegLR.
April 5, 2021 at 9:11 am #33836I want to achieve such a line with the current value
https://drive.google.com/file/d/1yK_xYoq_8r2G2kQpr4u0QeG7xqSwvyd7/view?usp=sharingApril 5, 2021 at 11:23 am #33854Hi.
I think it can be done by pre-defining a stlipline and assigning that pre-definition in axisY.
`let stline=[];
stline.push({value:YVALUE, [other option]})axisY : {
stripLines:stline,
:
}April 5, 2021 at 7:42 pm #33865You can create a dynamic stripLine by adding a stripLine and then updating its value and label property to the subsequent y-value of the latest dataPoints which have been added dynamically.
Please take a look at the code snippet below,
function updateChart() {
  $.getJSON("https://canvasjs.com/services/data/datapoints.php?xstart=" + (dataPoints.length + 1) + "&ystart=" + (dataPoints[dataPoints.length - 1].y) + "&length=1&type=json", function(data) {
    $.each(data, function(key, value) {
      dataPoints.push({
        x: parseInt(value[0]),
        y: parseInt(value[1])
      });
      chart.options.axisY.stripLines[0].value = value[1];
      chart.options.axisY.stripLines[0].label = value[1];
    });
    chart.render();
    setTimeout(function(){updateChart()}, 1000);
  });
}
Also, kindly take a look at this JSFiddle for an example to create a dynamic stripLine.
—
Adithya Menon
Team CanvasJSMay 8, 2021 at 2:53 am #34263Good day! Please tell me a way with an example of how you can add a second stripline to the chart so that it also dynamically follows the set value!
May 10, 2021 at 6:40 pm #34278You can add new stripLines dynamically by using the addTo method. If you like to update the values of the existing stripLines, you can use the set method.
If you are facing any issues, kindly create JSFiddle reproducing the issue you are facing with sample/dummy data and share it with us so that we can look into your code/chart options being used, understand the scenario better and help you out.
—
Adithya Menon
Team CanvasJS -
This topic was modified 5 years, 3 months ago by
You must be logged in to reply to this topic.