You must be logged in to post your query.
Home › Forums › Chart Support › Trigger reset zooming on wheel zooming
Following up on this https://canvasjs.com/forums/topic/method-call-for-zoom-pan-function-in-canvas-js/
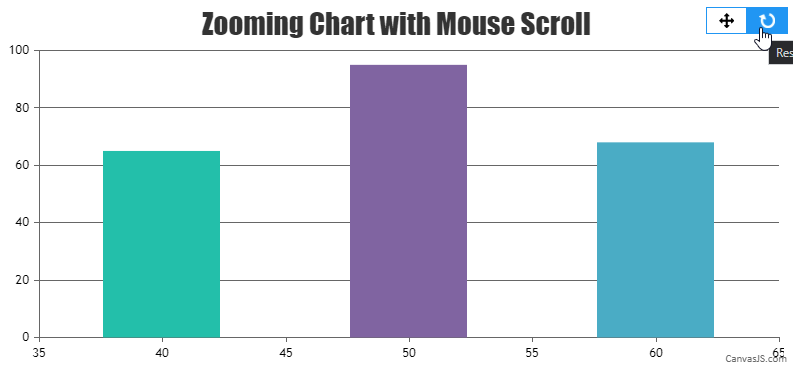
Clicking reset button does nothing. Is there a way to programatically trigger reset of the wheel zooming?
@myezasifiso,
You can reset the chart range programmatically by setting the viewportMinimum and viewportMaximum of x-axis to null inside the rangeChanged event handler as shown in the code snippet below –
rangeChanged: function(e) { if(e.trigger === "reset"){ e.chart.options.axisX[0].viewportMinimum = null; e.chart.options.axisX[0].viewportMaximum = null; e.chart.render(); } },
Please take a look at this JSFiddle for complete working code.
___________ Indranil Deo Team CanvasJS
Hi @Indranil Doe
Thank you for the reply and the hints. FYI: As this is developed using react, we needed a way to add and remove event listener, we finally used a useCallBack hook to always point to the original event handler.
All works fine now.
But! we also want to move the zoom port/area left and right as you would on the normal zooming but it get stuck. You can see on your example as well if you zoom, and try to move the zoomed area left and right it does nothing.
Can you give pointers to this.
Ow, sometimes it moves :-(,
But ultimately we want to be able to control the pan programatically.
The panning behavior seems to be working as designed. For the zoom/pan functionality to work there should be a minimum of 3-4 dataPoints within the viewport – behavior is designed such that zooming is limited upto a certain region, so the user doesn’t end up zooming into a blank-region (region with no dataPoints). Due to this restriction, it’s not possible to pan chart as you zoom into the region with just 2 dataPoint.
In the above JSFiddle example to make the panning functionality work, you can add a limit to zooming beyond 3 dataPoints as shown in the code snippet below –
if((newViewportMax - newViewportMin) > (2 * interval)){ dataPointCounter = 0; for ( var i = 0; i < chart.options.data[0].dataPoints.length; i++ ){ if(chart.options.data[0].dataPoints[i].x > newViewportMin && chart.options.data[0].dataPoints[i].x < newViewportMax){ dataPointCounter++; } } if(dataPointCounter > 3){ chart.axisX[0].set("viewportMinimum", newViewportMin, false); chart.axisX[0].set("viewportMaximum", newViewportMax); } }
Please take a look at this JSFiddle for the complete code.
You must be logged in to reply to this topic. Login/Register